














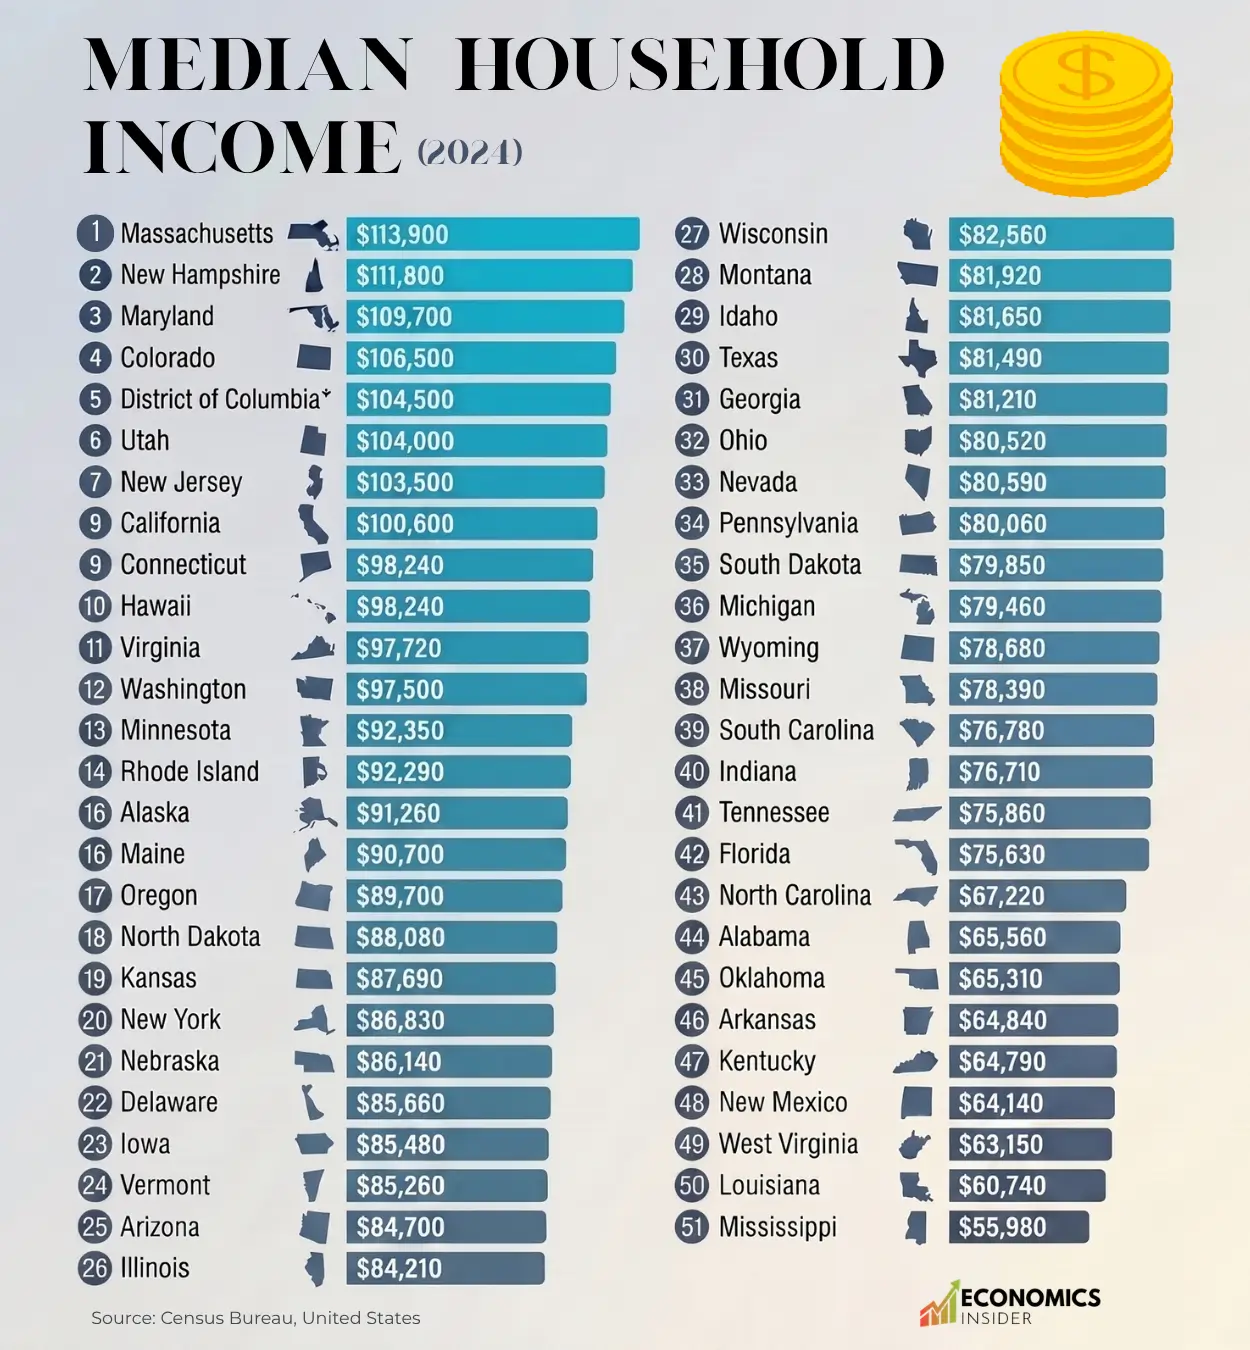
The U.S. median household income by state sits at $83,730, up from $82,690 the year before. But that single number hides a huge gap between states. Massachusetts households now bring home over $113,000 a year, while a typical household in Mississippi earns just under $56,000. That’s a difference of nearly $58,000, enough to buy a car in cash every single year.
The Northeast and the West Coast sit near the top, the Deep South sits near the bottom, and everyone else is scattered in between. Washington, D.C., long known as one of the wealthiest places in the United States, saw one of the largest declines in median household income in 2024. The median household income fell from $113,900 in 2023 to $104,800 in 2024, a drop of $9,100. Maine, on the other hand, jumped by more than $13,000, one of the biggest one-year gains.
Key Takeaways
- Massachusetts had the highest median household income in 2024 at $113,900, while Mississippi ranked last at $55,980.
- Maine recorded the biggest increase in the country. Its median household income rose from $77,700 in 2023 to $90,730 in 2024, an increase of $13,030 in just one year.
- Most Southern states remain clustered at the bottom of the list, while Northeastern and Mountain West states dominate the top.
What Is Median Household Income?
Median household income is the middle point of all household earnings in a given place. Picture lining up every household in a state from the lowest earner to the highest earner. The median is whatever number sits exactly in the middle of that line, meaning half of all households earn more than that number and half earn less.
This is different from average income, which can get pulled way up by a small number of extremely wealthy households. The median doesn’t have that problem. A handful of billionaires in a state won’t drag the median up the way they would an average, which is why economists and researchers rely on median household income by state data to get a more honest read on how a typical family is actually doing.
Median Household Income by State, 2024
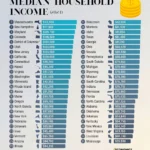
The table below shows the latest median household income by state using 2024 data from the U.S. Census Bureau’s American Community Survey (ACS).
| Rank | State | 2024 | 2023 | Change |
|---|---|---|---|---|
| — | United States | $83,730 | $82,690 | +$1,040 |
| 1 | Massachusetts | $113,900 | $109,300 | +$4,600 |
| 2 | New Hampshire | $111,800 | $101,300 | +$10,500 |
| 3 | Maryland | $109,700 | $104,600 | +$5,100 |
| 4 | Colorado | $106,500 | $99,140 | +$7,360 |
| 5 | District of Columbia* | $104,800 | $113,900 | −$9,100 |
| 6 | Utah | $104,000 | $103,800 | +$200 |
| 7 | New Jersey | $103,500 | $93,960 | +$9,540 |
| 8 | California | $100,600 | $92,200 | +$8,400 |
| 9 | Connecticut | $99,240 | $94,620 | +$4,620 |
| 10 | Hawaii | $98,240 | $99,880 | −$1,640 |
| 11 | Virginia | $97,720 | $98,990 | −$1,270 |
| 12 | Washington | $97,500 | $95,850 | +$1,650 |
| 13 | Minnesota | $92,350 | $92,680 | −$330 |
| 14 | Rhode Island | $92,290 | $83,980 | +$8,310 |
| 15 | Alaska | $91,260 | $100,700 | −$9,440 |
| 16 | Maine | $90,730 | $77,700 | +$13,030 |
| 17 | Oregon | $89,700 | $91,030 | −$1,330 |
| 18 | North Dakota | $88,080 | $78,950 | +$9,130 |
| 19 | Kansas | $87,690 | $87,030 | +$660 |
| 20 | New York | $86,830 | $83,710 | +$3,120 |
| 21 | Nebraska | $86,140 | $91,500 | −$5,360 |
| 22 | Delaware | $85,860 | $88,570 | −$2,710 |
| 23 | Iowa | $85,480 | $82,950 | +$2,530 |
| 24 | Vermont | $85,260 | $87,400 | −$2,140 |
| 25 | Arizona | $84,700 | $84,800 | −$100 |
| 26 | Illinois | $84,210 | $90,090 | −$5,880 |
| 27 | Wisconsin | $82,560 | $81,750 | +$810 |
| 28 | Montana | $81,920 | $81,270 | +$650 |
| 29 | Idaho | $81,650 | $75,820 | +$5,830 |
| 30 | Texas | $81,490 | $81,110 | +$380 |
| 31 | Georgia | $81,210 | $74,290 | +$6,920 |
| 32 | Ohio | $80,520 | $75,680 | +$4,840 |
| 33 | Nevada | $80,590 | $83,410 | −$2,820 |
| 34 | Pennsylvania | $80,060 | $81,880 | −$1,820 |
| 35 | South Dakota | $79,850 | $83,860 | −$4,010 |
| 36 | Michigan | $79,460 | $78,950 | +$510 |
| 37 | Wyoming | $78,680 | $79,200 | −$520 |
| 38 | Missouri | $78,390 | $80,310 | −$1,920 |
| 39 | South Carolina | $76,780 | $70,890 | +$5,890 |
| 40 | Indiana | $76,710 | $78,900 | −$2,190 |
| 41 | Tennessee | $75,860 | $74,580 | +$1,280 |
| 42 | Florida | $75,630 | $74,070 | +$1,560 |
| 43 | North Carolina | $67,220 | $70,390 | −$3,170 |
| 44 | Alabama | $65,560 | $62,230 | +$3,330 |
| 45 | Oklahoma | $65,310 | $69,070 | −$3,760 |
| 46 | Arkansas | $64,840 | $64,880 | −$40 |
| 47 | Kentucky | $64,790 | $63,590 | +$1,200 |
| 48 | New Mexico | $64,140 | $62,560 | +$1,580 |
| 49 | West Virginia | $63,150 | $61,970 | +$1,180 |
| 50 | Louisiana | $60,740 | $59,140 | +$1,600 |
| 51 | Mississippi | $55,980 | $56,490 | −$510 |
The Top Earning States
Massachusetts
Massachusetts sits at the very top of the list, with a median household income of $113,900. That’s up from $109,300 the year before, a solid gain that pushed it past Washington D.C. The state’s mix of hospitals, universities, and tech companies around Boston keeps pulling in high-paying jobs, and that shows up directly in the numbers.
New Hampshire
New Hampshire comes in second at $111,800, up sharply from $101,300. No state income tax and easy access to Boston’s job market make it an attractive place to live while working a high-paying job across the border. That combination has quietly made New Hampshire one of the richest states in the country.
Maryland
It ranks third with real median income at $109,700, only a small step down from the year before. Maryland benefits from its closeness to Washington D.C. and a large share of federal government and defense-related jobs, which tend to pay well and stay stable even when the broader economy wobbles.
Colorado
Colorado holds fourth place at $106,500, up from $99,140. Denver’s growing tech and outdoor recreation industries, along with a wave of people moving in from more expensive states, have pushed incomes up steadily over the past few years.
Washington D.C.
Washington D.C. dropped to fifth place at $104,800, down nearly $10,000 from $113,900. This is one of the sharpest one-year declines on the entire list. D.C.’s income numbers can swing more than most states because its population is small and its economy leans heavily on federal jobs and contracting, both of which have faced pressure recently.
How Many Years It Takes to Buy a Home in Each U.S. State
The Lowest Earning States
Mississippi
Mississippi remains the lowest-earning state in the country at $55,980, and it’s the only state below the $56,000 mark. The state relies heavily on agriculture and lower-wage service jobs, and it continues to face some of the highest poverty rates in the nation.
Louisiana
Louisiana sits just above Mississippi at $60,740. Energy and shipping industries provide some higher-paying jobs along the coast, but much of the rest of the state’s economy remains tied to lower-wage work, keeping the overall median low.
West Virginia
West Virginia comes in at $63,150. A shrinking coal industry and an aging population have made it hard for the state to keep pace with income growth seen elsewhere in the country.
New Mexico ranks at $64,140. Despite growth in energy production in the southeastern part of the state, high poverty rates in rural areas continue to drag down the statewide median.
Kentucky and Arkansas round out the lowest group at $64,790 and $64,840. Both states have economies built around manufacturing, agriculture, and logistics industries that provide steady work but rarely produce the high salaries seen in coastal tech hubs or finance centers.
Other Notable States Worth Watching
Maine posted one of the biggest jumps in the entire median household income by state dataset, climbing from $77,700 to $90,730, a gain of about $13,000 in a single year. That’s a huge move for a state that has historically sat in the middle of the pack.
Alaska moved in the opposite direction, falling from $100,700 to $91,260. Alaska’s economy is closely tied to oil prices and production levels, so swings like this aren’t unusual, but a drop this size is still notable.
North Carolina slipped from $70,390 to $67,220, even as most of its neighbors in the South posted gains. This bucks the regional trend and suggests something specific is happening in the state’s labor market that’s worth digging into further.
California, the country’s largest state by population, jumped from $92,200 to $100,600.
Texas, the second-largest state by population, barely moved at all, going from $81,110 to $81,490. That’s a nearly flat year for one of the country’s biggest economies, and it stands in contrast to the bigger swings seen in states like California and Maine.
Higher Income Doesn’t Always Mean Greater Affordability
Income tells only part of the story. Many of the highest-income states also have some of the country’s highest housing prices and living costs. A household earning more than $100,000 in Massachusetts or California may still spend a large share of its income on housing, childcare, transportation, and healthcare.
Meanwhile, some lower-income states have lower living costs, although wages are also generally lower. For this reason, economists often compare median household income by state with the local cost of living to better understand financial well-being.
The Bottom Line
The latest Census Bureau data shows that median household income by state isn’t just rising or falling as one big block, it’s moving in very different directions depending on where you live. Nationally, the median household income reached $83,730, while several states crossed the $100,000 mark for the first time. However, the differences between states remain significant. The highest-income state earned more than twice as much as the lowest-income state.