











Owning a home remains one of the biggest financial goals for many Americans. While not all professions experience the same level of homeownership, factors such as salary, job stability, and career growth influence individuals’ ability to purchase a home. These differences are reflected in the latest Homeownership Rates in the US across various occupations.
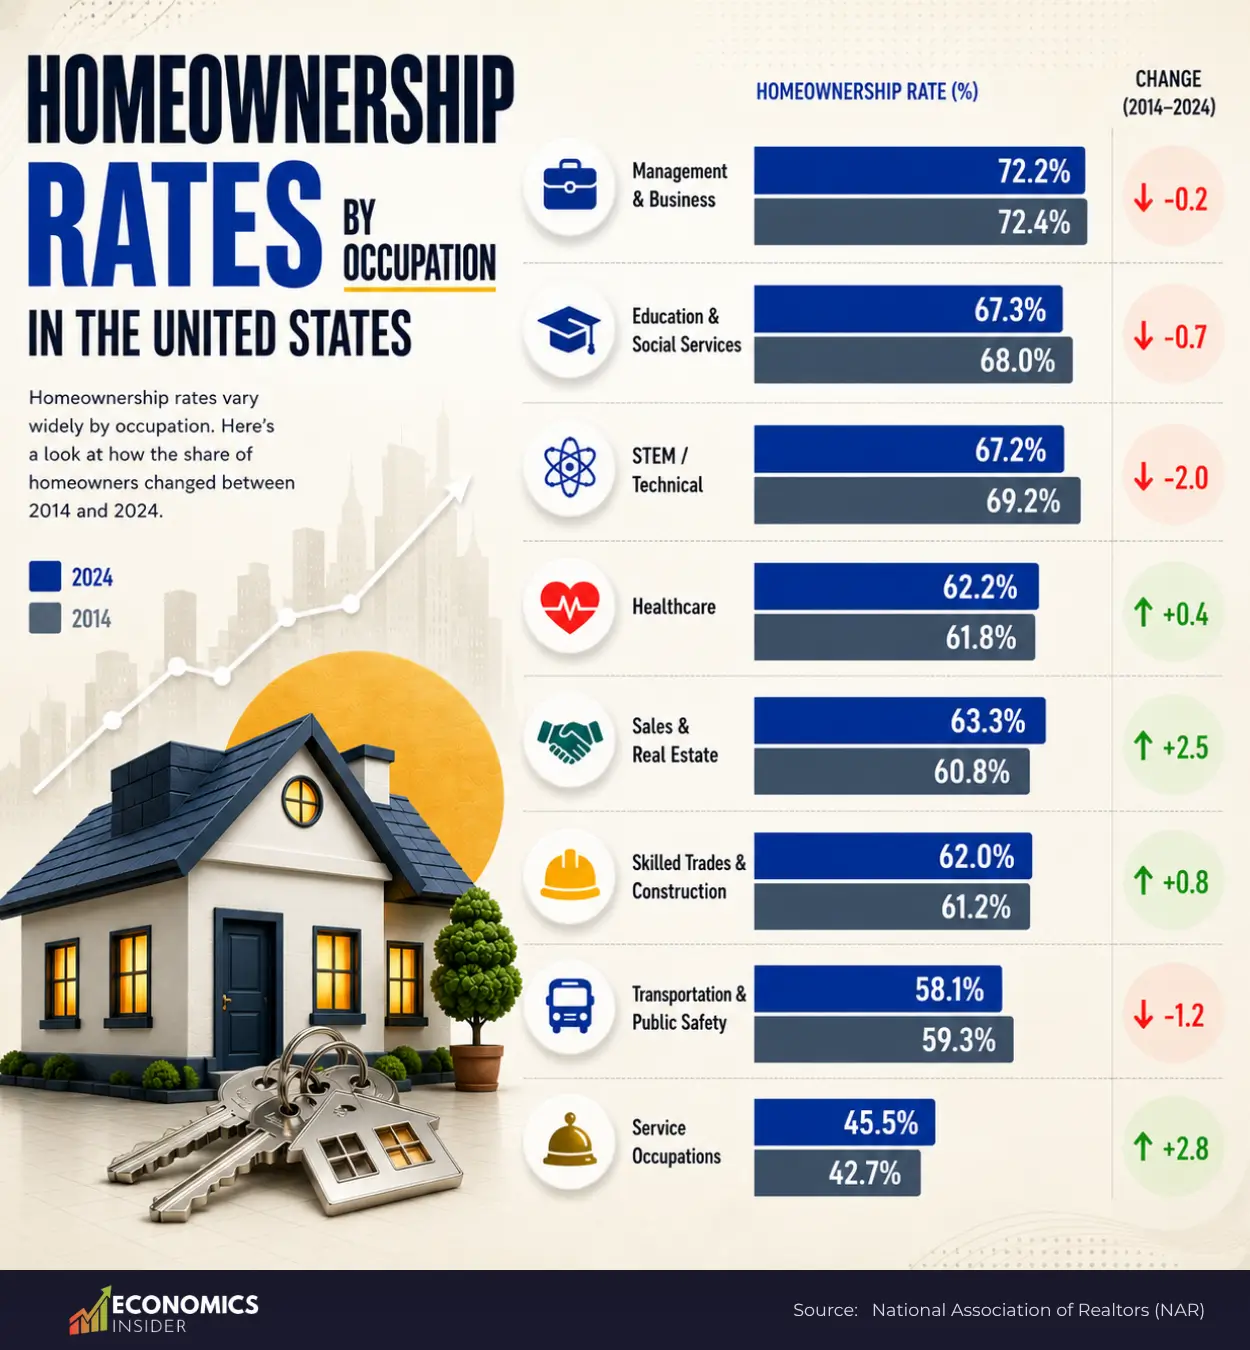
Recent data from the National Association of Realtors (NAR) compares homeownership rates among major occupations in 2024 with those from 2014. Some occupations have seen significant increases, while others have faced slight declines over the past decade.
Key Takeaways
- People in management and business roles still own homes at the highest rate of any group, even though that rate barely moved over the past ten years
- Service workers have the lowest homeownership rate by far, but they’re also the group that improved the most since 2014.
- Some fields like STEM and tech, actually saw their homeownership rate drop.
Homeownership Rates in the US
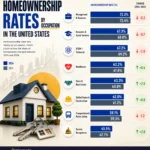
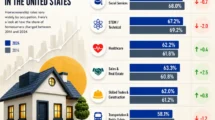
The table below compares homeownership rates in the US across major occupations in 2024 and 2014. The data comes from the National Association of Realtors (NAR) and is based on the American Community Survey Public Use Microdata Sample (ACS PUMS). Comparing the 2024 numbers to 2014 shows how each occupation’s homeownership rate has moved over a full decade.
| Occupation | 2024 | 2014 | Change |
|---|---|---|---|
| Management & Business | 72.20% | 72.40% | -0.2 |
| Education & Social Services | 67.30% | 68.00% | -0.7 |
| STEM / Technical | 67.20% | 69.20% | -2 |
| Sales & Real Estate | 63.30% | 60.80% | 2.5 |
| Healthcare | 62.20% | 61.80% | 0.4 |
| Skilled Trades & Construction | 62.00% | 61.20% | 0.8 |
| Transportation & Public Safety | 58.10% | 59.30% | -1.2 |
| Service Occupations | 45.50% | 42.70% | 2.8 |
Management and Business: Still on Top
Managers and business professionals have the highest homeownership rate of any group, at 72.2%. These jobs tend to pay well and offer steady, long-term careers, both of which make it easier to qualify for a mortgage and save for a down payment. However, this group actually dipped slightly over the decade, down two-tenths of a point.
Education and Social Services
Teachers, social workers, and others in this field saw their homeownership rate drop from 68.0% to 67.3%. It’s a small decline, but it fits a pattern many people in these fields already feel in their daily lives. Wages in education and social work haven’t kept pace with home prices, and that gap adds up over ten years.
STEM and Technical Jobs
Tech and STEM workers are often thought of as the highest earners in the modern economy, yet their homeownership rate fell more than any other group except transportation, dropping two full percentage points from 69.2% to 67.2%.
A likely cause is where these jobs are concentrated. Tech workers cluster in expensive coastal cities like San Francisco, Seattle, and New York, where home prices have climbed much faster than salaries, even high salaries. Good pay doesn’t help much when the homes nearby cost even more.
How Many Years It Takes to Buy a Home in Each U.S. State
Healthcare
Healthcare workers, from nurses to doctors to support staff, saw their homeownership rate tick up slightly, from 61.8% to 62.2%. It’s a modest gain, but it’s a gain nonetheless, and it suggests healthcare has held up reasonably well through a decade that was tough on housing affordability overall.
Sales and Real Estate
People working in sales and real estate saw one of the largest jumps in the entire dataset, rising from 60.8% to 63.3%, a gain of two and a half percentage points. This group often has variable, commission-based income, so a rising homeownership rate here suggests strong earning years for many in the field, along with the industry knowledge that naturally comes from working in real estate itself.
Skilled Trades and Construction
Electricians, plumbers, carpenters, and other trade workers saw a solid increase too, up from 61.2% to 62.0%. Demand for skilled trades has grown as construction and renovation work picked up, and wages in these fields have been rising faster than in a lot of white-collar work. Therefore, more of these workers being able to buy homes.
Transportation and Public Safety
This group had the second-largest drop in the dataset, falling from 59.3% to 58.1%. Jobs in this category include drivers, transit workers, police officers, and firefighters. Many of these roles come with irregular hours, physically demanding conditions, and pay that hasn’t always kept up with the cost of living in the areas where these jobs are most needed, like large cities.
Service Occupations
Service workers, think food service, retail, personal care, and similar roles, have by far the lowest homeownership rate of any group at 45.5%. But here’s the twist: this group also improved the most of anyone, climbing from 42.7% to 45.5%, a jump of nearly three full percentage points. It’s still the toughest group to own a home in, but it’s moving in the right direction faster than any other occupation on this list.
Bottom Line
Homeownership rates in the US vary widely across occupations. Jobs with higher incomes and greater financial stability typically have higher homeownership rates. However, changes over the last decade have been relatively minor, indicating that occupation remains a major factor in determining who can afford to buy a home.