




The United States does not apply a uniform tariff on all its trading partners anymore; rather, the actual rates depend on the country and the type of goods being imported.
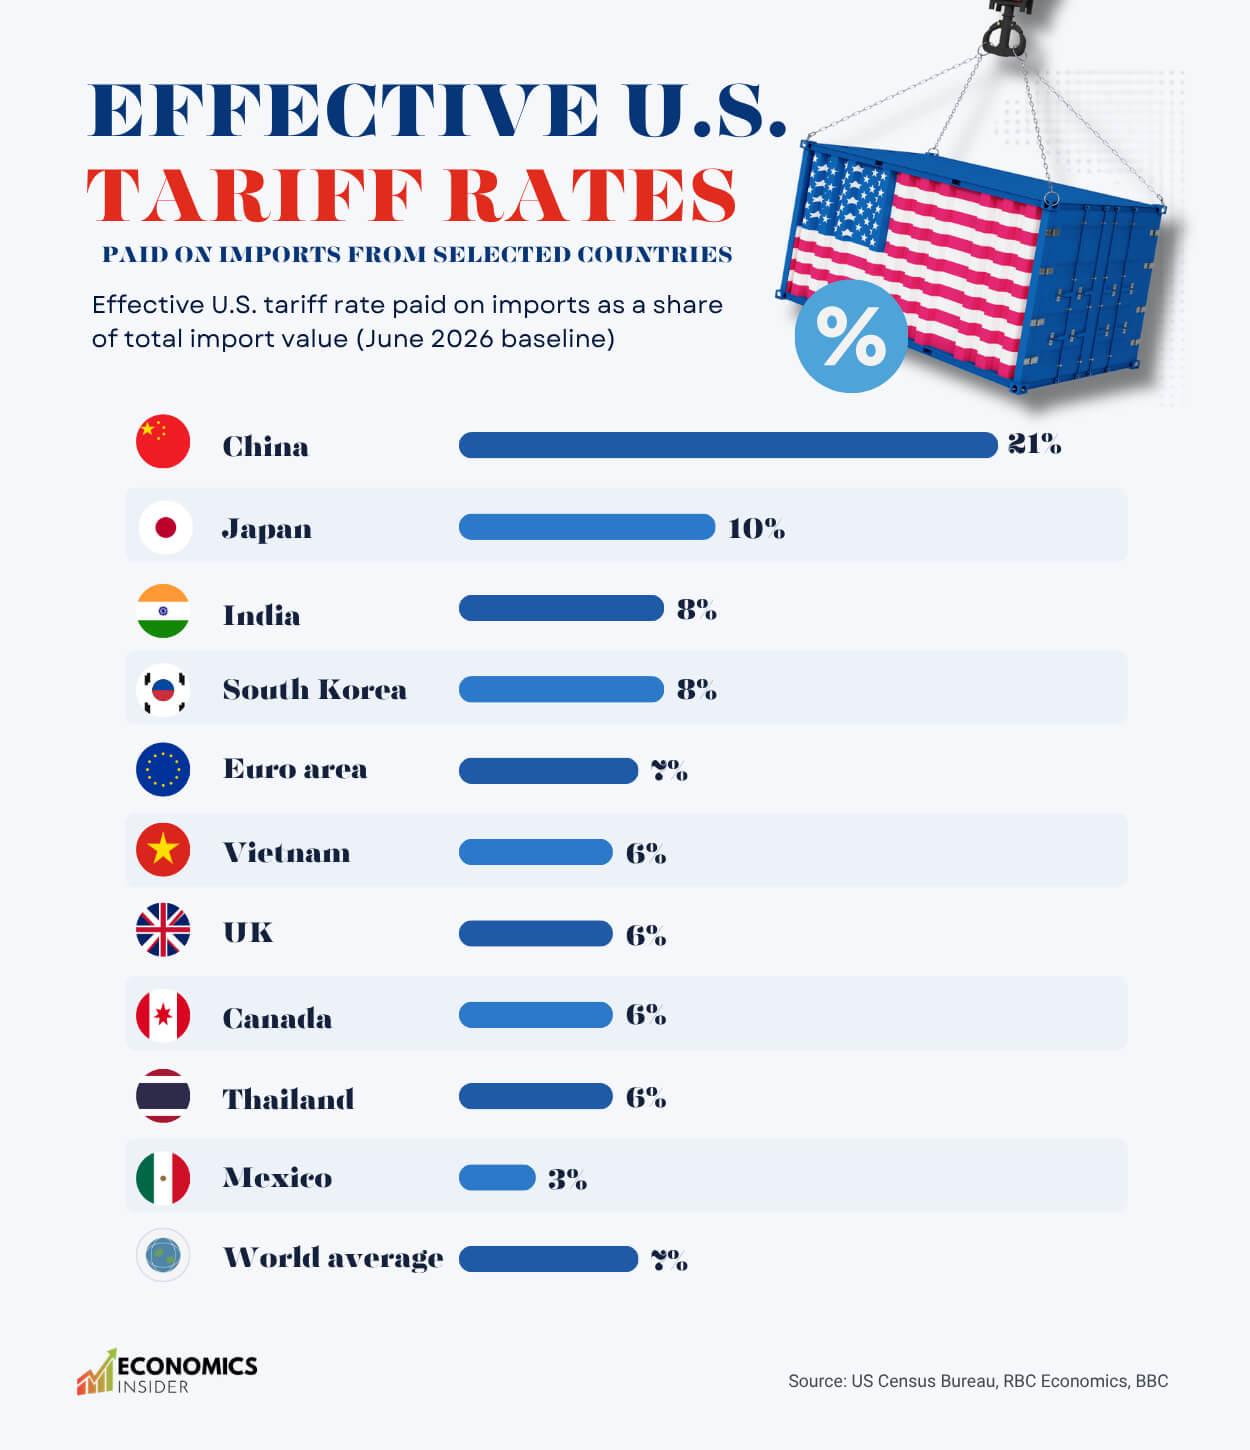
According to the baseline of June 2026, the average effective U.S. tariff rate was around 7% of the value of imports. But some major trading partners faced much higher rates. China stood out at 21%, while Japan faced 10% and India and South Korea each faced 8%.
The effective rate is important because it shows what importers actually paid in customs duties relative to the value of the goods entering the United States. Penn Wharton, using U.S. International Trade Commission data, also put the overall June 2026 effective rate at about 7.1%.
Key Takeaways
- China faced the highest effective tariff rate among the major economies in the table, at 21%.
- Japan, India and South Korea also faced rates above the 7% world average.
- Mexico had one of the lowest rates at 3%, while Canada stood at 6% despite the two countries’ highly integrated trade relationship.
Effective U.S. Tariff Rates
The effective U.S. tariff rate measures the tariffs actually paid on imports as a share of their total import value. For the June 2026 baseline, the figures are based on trade and economic data from the U.S. Census Bureau, RBC Economics, and BBC.
| Country / Region | Effective U.S. Tariff Rate |
|---|---|
| 🇨🇳 China | 21% |
| 🇯🇵 Japan | 10% |
| 🇮🇳 India | 8% |
| 🇰🇷 South Korea | 8% |
| 🇪🇺 Euro area | 7% |
| 🇻🇳 Vietnam | 6% |
| 🇬🇧 UK | 6% |
| 🇨🇦 Canada | 6% |
| 🇹🇭 Thailand | 6% |
| 🇲🇽 Mexico | 3% |
| 🌎 World average | 7% |
China Faces the Heaviest Tariff Burden
At 21%, China’s effective U.S. tariff rate was three times the world average of 7%. This is indicative of the far deeper trade dispute that exists between Washington and Beijing and which has involved tariffs, sanctions on strategic goods, and broader industrial policies of China.
Tariffs have also forced companies to reconsider their production centers. For instance, Vietnam has gained a number of manufacturing facilities owing to companies’ desire to move away from China. In the first half of 2026, U.S. imports from Vietnam increased significantly, while imports from China decreased. American businesses still depend heavily on Chinese factories and supply chains, particularly for electronics, machinery and other manufactured goods.
Japan Is Next at 10%
Japan’s 10% effective tariff rate is considerably lower than China’s, but it is still above the 7% global average.
Japan is an important U.S. trading partner, particularly in automobiles, machinery and electronics. The two countries have also negotiated tariff arrangements during 2026, with the U.S. maintaining agreed tariff limits for Japan and other partners.
That makes Japan an interesting case. It is a close U.S. ally, yet Japanese exporters are still dealing with a significantly higher U.S. tariff burden than they faced before the recent trade-policy changes.
India and South Korea Face 8%
Both India and South Korea recorded an effective rate of 8%. That puts them only slightly above the world average, but the numbers hide important differences.
India’s trade relationship with the U.S. has become more complicated because tariffs have been mixed with other disputes, including India’s purchases of Russian oil. South Korea, meanwhile, is deeply connected to U.S. supply chains through automobiles, electronics, batteries and other manufactured goods.
South Korea also falls into the group of economies that received a 12.5% tariff ceiling under the newer Section 301 measures, although the effective rate actually paid on imports can be lower because not every product is subject to the same duties.
Canada
Canada’s 6% effective rate looks relatively modest compared with China, Japan or India. But Canada is a particularly important case because the U.S. and Canadian economies are closely connected. Automobiles, energy, machinery, food and other goods cross the border as part of highly integrated supply chains.
The Bank of Canada estimated that the average U.S. tariff rate on Canadian goods was around 5% in July 2026, with many products still benefiting from exemptions under the USMCA.
However, the situation has become more complicated. Sector-specific tariffs have created much higher rates for some Canadian products. For example, the U.S. announced a 50% tariff on Canadian vehicles, auto parts and trucks starting in 2027.
So Canada’s 6% overall effective rate should not be interpreted as meaning every Canadian product faces a 6% tariff.
Europe Is Close to the World Average
The Euro area had an effective rate of 7%, exactly matching the world average. That is significant because Europe is one of America’s largest trading partners. European companies sell everything from cars and machinery to medicines and luxury goods in the U.S. market.
The overall figure also hides differences between products. Some goods can face additional tariffs while others may be covered by exemptions or negotiated arrangements.
Vietnam Is Becoming More Important
Vietnam’s 6% effective rate is lower than China’s 21%. That difference has become economically important.
Companies looking to reduce their exposure to China can move some production to Vietnam while continuing to sell to American consumers. U.S. imports from Vietnam increased strongly during the first half of 2026, while Chinese imports fell.
This is one of the clearest ways tariffs can change global supply chains: they can make one country more expensive while making another country relatively more attractive.
Mexico Has the Lowest Rate
At just 3%, Mexico had the lowest effective tariff rate. Mexico’s position is especially important because the U.S., Mexico and Canada form a highly integrated North American manufacturing network.
A large amount of production crosses borders several times before a finished product reaches consumers. Automobiles are a good example: parts can be produced in one country, assembled in another and then sold across North America.
The Bottom Line
The biggest lesson from these numbers is that the U.S. tariff system is no longer affecting every trading partner equally. China is facing a much heavier burden than Mexico, Vietnam or Canada. Japan and South Korea sit somewhere in the middle, while Europe is around the global average.
And these differences matter. A company deciding where to manufacture a product now has to consider not only wages, transportation and access to suppliers, but also how much it will cost to bring that product into the United States.
That is already changing trade flows. Vietnam has gained production and exports as companies reduce their dependence on China, while U.S. trade policy continues to change the incentives for businesses around the world.