
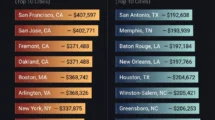
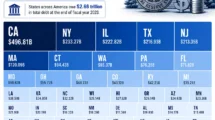


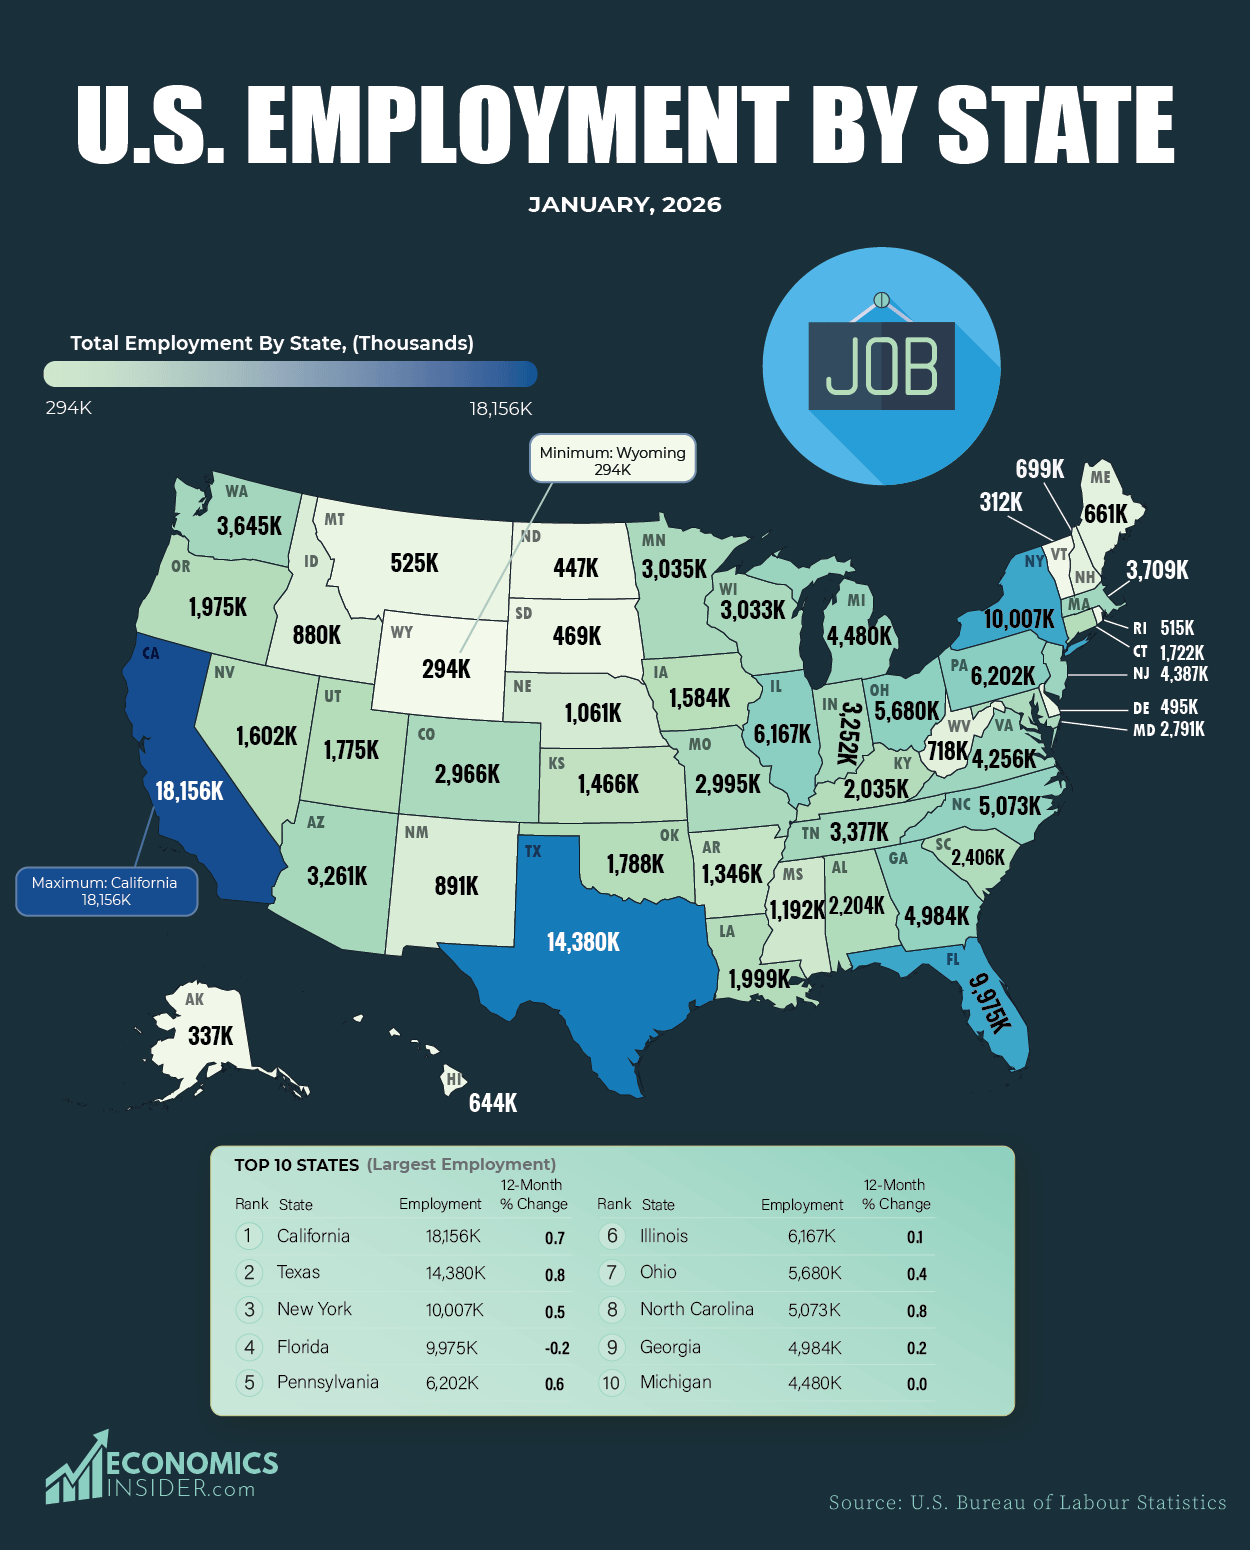
The latest U.S. state employment data from the Bureau of Labor Statistics indicate that some large states added more jobs over the past 12 months. They are led by California, Texas, Florida, and New York, among others.
In January 2026, California had the largest number of jobs in the country at 18.2 million. The second state was Texas with 14.4 million jobs, followed by Florida and New York with 10 million jobs each. Together, these states account for a major share of total U.S. employment.
At the other extreme, the smallest states had fewer employment levels compared to the larger ones. Wyoming recorded 293,500 jobs, Vermont had 311,600, and Alaska reported 337,100 jobs.
Key Takeaways
- Texas and California created the most jobs in raw numbers, which shows their economic diversity and size.
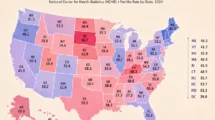
- Nevada and South Carolina posted some of the fastest percentage growth in jobs, reflecting their robust economic performance.
- Several states lost jobs, especially Maryland, the District of Columbia, Oregon, Virginia, and Florida.
Employment by State – January 2026
The following data is based on the latest release from the U.S. Bureau of Labor Statistics (BLS) as of January 2026. It reflects seasonally adjusted total nonfarm employment by state, measured in thousands of jobs.
| State | Total Employment | 12-Month % Change |
|---|---|---|
| Alabama | 2,204K | 0.4 |
| Alaska | 337K | -0.2 |
| Arizona | 3,261K | -0.5 |
| Arkansas | 1,346K | 0.9 |
| California | 18,156K | 0.7 |
| Colorado | 2,966K | -0.4 |
| Connecticut | 1,722K | 0.3 |
| Delaware | 495K | -0.1 |
| District of Columbia | 720K | -5.9 |
| Florida | 9,975K | -0.2 |
| Georgia | 4,984K | 0.2 |
| Hawaii | 644K | 0 |
| Idaho | 880K | 0.8 |
| Illinois | 6,167K | 0.1 |
| Indiana | 3,252K | -0.4 |
| Iowa | 1,584K | -1 |
| Kansas | 1,466K | 0.5 |
| Kentucky | 2,035K | 0.4 |
| Louisiana | 1,999K | 0.1 |
| Maine | 661K | -0.3 |
| Maryland | 2,791K | -1.7 |
| Massachusetts | 3,709K | -0.4 |
| Michigan | 4,480K | 0 |
| Minnesota | 3,035K | 0.4 |
| Mississippi | 1,192K | 0.1 |
| Missouri | 2,995K | 0.9 |
| Montana | 525K | -0.2 |
| Nebraska | 1,061K | -0.1 |
| Nevada | 1,602K | 1.9 |
| New Hampshire | 699K | -0.7 |
| New Jersey | 4,387K | 0.3 |
| New Mexico | 891K | -0.4 |
| New York | 10,007K | 0.5 |
| North Carolina | 5,073K | 0.8 |
| North Dakota | 447K | -0.3 |
| Ohio | 5,680K | 0.4 |
| Oklahoma | 1,788K | -0.2 |
| Oregon | 1,975K | -0.9 |
| Pennsylvania | 6,202K | 0.6 |
| Rhode Island | 515K | -0.4 |
| South Carolina | 2,406K | 1.3 |
| South Dakota | 469K | -0.1 |
| Tennessee | 3,377K | 0.2 |
| Texas | 14,380K | 0.8 |
| Utah | 1,775K | 0.8 |
| Vermont | 312K | -0.7 |
| Virginia | 4,256K | -0.5 |
| Washington | 3,645K | 0.3 |
| West Virginia | 718K | 0.5 |
| Wisconsin | 3,033K | -0.5 |
| Wyoming | 294K | -0.3 |
| Puerto Rico | 949K | -0.4 |
U.S. Bureau of Labor Statistics
Texas and California Continue to Dominate Job Creation
The two largest gainers in raw numbers were California and Texas. California added 131,200 jobs over the year, while Texas added 112,200. These numbers matter because both states are large enough to influence national payroll growth.
California benefits from major industries such as technology, logistics, entertainment, healthcare, and agriculture. Even a moderate percentage growth creates a large number of jobs because the state already has a huge workforce.
Texas benefits from population growth, business investment, energy production, manufacturing, and a business-friendly environment. Cities like Dallas, Houston, Austin, and San Antonio remain important employment centers in Texas.
New York and North Carolina Show Solid Gains
New York gained 45,300 jobs, demonstrating strength despite fears of high prices and weaker office demand. North Carolina added 41,900 jobs, one of the strongest performances among medium-to-large states. The state has become a magnet for new business investment, technology hiring, and population inflows.
This shows that Job growth is not only happening in traditional giant states. Mid-sized states with expanding industries also outperform in the U.S. jobs market.
Nevada Leads Percentage Growth Over the Past-12 Months
When looking at percentage growth rather than raw numbers, Nevada stood out with 1.9% annual growth, the highest among all U.S. states. That translated into 30,200 new jobs.
Nevada’s labor market depends heavily on tourism, entertainment, hospitality, and construction. Therefore, continued recovery in travel and new housing demand supports hiring.
South Carolina followed with 1.3% growth in employment and added 31,500 jobs.
Florida Shows Unexpected Job Loss
Florida lost 20,600 jobs over the year. It has been one of the strongest growth states in recent years due to migration, tourism, and construction. A decline does not necessarily mean weakness, but it may signal that the previous rapid expansion is slowing. Housing affordability pressures, higher interest rates, and slower migration could become possible factors that affect hiring.
Government-Heavy Regions Faced Pressure
The District of Columbia saw the sharpest percentage drop at -5.9%, losing 45,300 jobs. This is important since Washington’s economy is highly dependent on activities related to the federal government, contracting, law, and policy agencies. Maryland’s employment numbers also declined by -1.7%, representing a loss of 49,300 jobs.
Midwest States Show Mostly Slow Growth
Many Midwestern states posted modest growth in jobs. Ohio gained 23,100 jobs, while Missouri added 26,300. Minnesota gained 12,900, and Wisconsin lost 15,400.
Illinois was nearly flat with 0.1% growth, adding only 7,900 jobs despite being one of the largest state economies.
Smaller States Remain Stable
Many smaller states showed only small changes in employment. States such as Delaware, Rhode Island, Maine, Montana, Nebraska, and Wyoming saw moves of just a few thousand jobs or fewer.
That is common in smaller economies, where even a modest hiring change can move the percentage rate but not create large headline job totals.
These states often depend more on local industries, healthcare, education, tourism, or energy rather than on massive diversified sectors.
What This Means for the U.S. Economy
January 2026 figures indicate that the economy’s workforce is growing, but progress is not consistent. While the fastest-growing states keep recruiting, many other states are either stagnant or shedding jobs.
It is typical to observe this development towards the end of a cycle where interest rates are rising, consumer spending is slowing down, and businesses become cautious about hiring employees.
Conclusion
In January 2026, job creation in the United States was not all one way. Employment creation still dominated in the states of California and Texas. Additionally, Nevada and South Carolina showed the greatest percentage growth. At the same time, states such as Maryland, Florida, Virginia, Oregon, and the District of Columbia lost jobs.
The labor market is no longer rising everywhere at the same pace. Growth is becoming selective, regional, and more dependent on local industries.