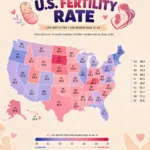


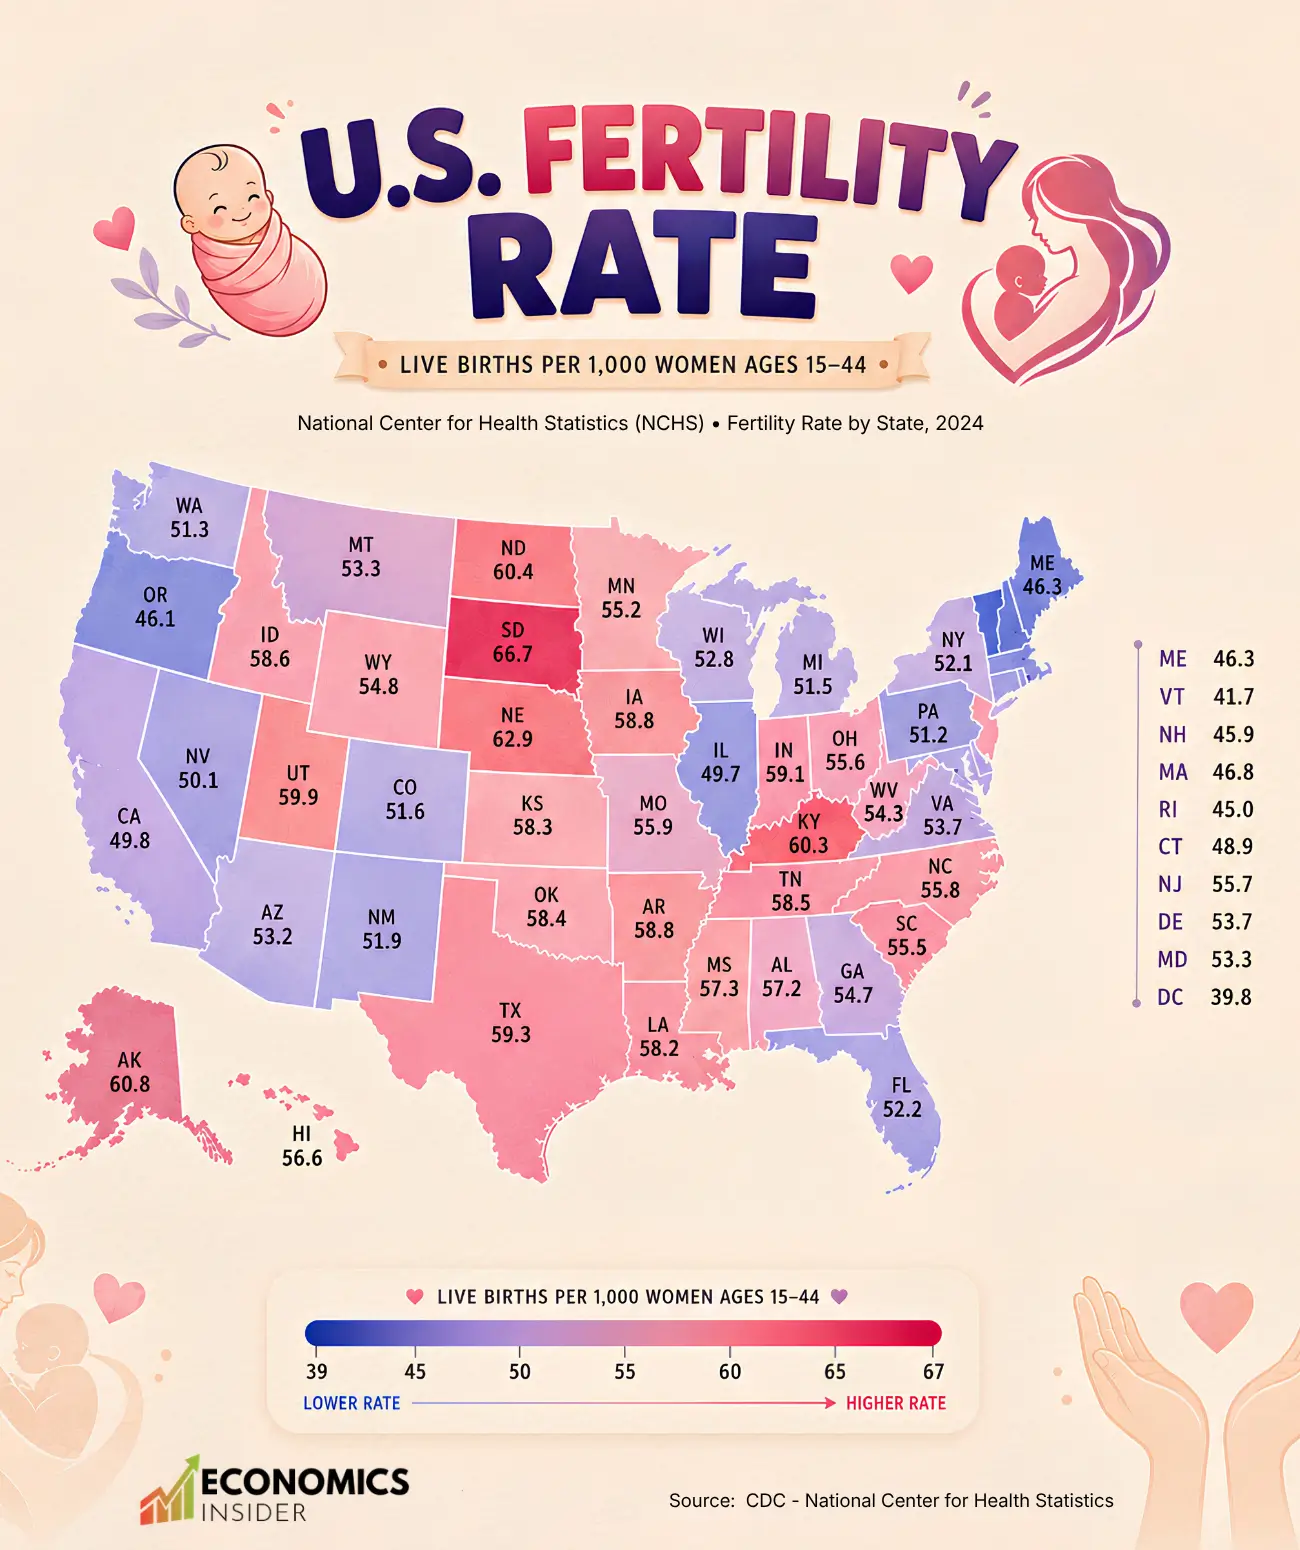
The U.S. fertility rate varied widely from state to state. Some states recorded very high birth numbers, while others sat near record lows. The CDC tracks these figures as live births per 1,000 women between the ages of 15 and 44.
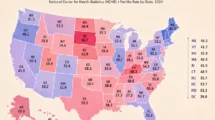
South Dakota had the highest fertility rate in the country, at 66.7. That means for every 1,000 women of childbearing age living there, nearly 67 births were recorded. On the other end, the District of Columbia had the lowest rate of all, just 39.8. Vermont came in second lowest among states at 41.7, followed by Rhode Island at 45.0. The gap between the top and bottom is striking. South Dakota’s rate is nearly 68% higher than D.C.’s.
Key Takeaways
- South Dakota leads the nation with a fertility rate of 66.7, while the District of Columbia sits at the bottom with just 39.8.
- Most of the states with the highest birth rates are in the South and the Plains, including Texas (59.3), Nebraska (62.9), and North Dakota (60.4), while the lowest rates are concentrated in the Northeast and urban centers.
- Most states fall within a fairly narrow range between about 50 and 60 births per 1,000 women ages 15–44.
U.S. Fertility Rate by State
The table below shows the 2024 fertility rate and total live births for every U.S. state and the District of Columbia. The U.S. fertility rate is measured as live births per 1,000 women between the ages of 15 and 44. All figures come from the CDC’s National Center for Health Statistics (NCHS).
| State | Fertility Rate | Births |
|---|---|---|
| Alabama | 57.2 | 57,934 |
| Alaska | 60.8 | 8,943 |
| Arizona | 53.2 | 78,711 |
| Arkansas | 58.8 | 35,395 |
| California | 49.8 | 402,075 |
| Colorado | 51.6 | 64,268 |
| Connecticut | 48.9 | 34,599 |
| Delaware | 53.7 | 10,550 |
| District of Columbia | 39.8 | 7,616 |
| Florida | 52.2 | 224,389 |
| Georgia | 54.7 | 126,437 |
| Hawaii | 56.6 | 14,917 |
| Idaho | 58.6 | 23,276 |
| Illinois | 49.7 | 125,731 |
| Indiana | 59.1 | 80,257 |
| Iowa | 58.8 | 36,436 |
| Kansas | 58.3 | 33,984 |
| Kentucky | 60.3 | 52,913 |
| Louisiana | 58.2 | 53,305 |
| Maine | 46.3 | 11,601 |
| Maryland | 53.3 | 65,797 |
| Massachusetts | 46.8 | 68,184 |
| Michigan | 51.5 | 99,525 |
| Minnesota | 55.2 | 62,110 |
| Mississippi | 57.3 | 33,473 |
| Missouri | 55.9 | 67,998 |
| Montana | 53.3 | 11,331 |
| Nebraska | 62.9 | 24,785 |
| Nevada | 50.1 | 32,381 |
| New Hampshire | 45.9 | 11,770 |
| New Jersey | 55.7 | 101,372 |
| New Mexico | 51.9 | 21,328 |
| New York | 52.1 | 205,489 |
| North Carolina | 55.8 | 122,856 |
| North Dakota | 60.4 | 9,634 |
| Ohio | 55.6 | 126,795 |
| Oklahoma | 58.4 | 47,962 |
| Oregon | 46.1 | 38,963 |
| Pennsylvania | 51.2 | 127,299 |
| Rhode Island | 45 | 10,009 |
| South Carolina | 55.5 | 58,768 |
| South Dakota | 66.7 | 11,451 |
| Tennessee | 58.5 | 83,833 |
| Texas | 59.3 | 390,828 |
| Utah | 59.9 | 46,664 |
| Vermont | 41.7 | 5,023 |
| Virginia | 53.7 | 94,054 |
| Washington | 51.3 | 83,118 |
| West Virginia | 54.3 | 17,022 |
| Wisconsin | 52.8 | 59,686 |
| Wyoming | 54.8 | 6,089 |
The High-Rate States
South Dakota, Nebraska, Alaska, North Dakota, and Utah all sit above 59 births per 1,000 women. These states share some common traits. They tend to have younger average populations, stronger cultural traditions around family size, and lower costs of living compared to coastal cities. Utah, in particular, has long been known for its high birth rates.
Texas and Indiana are also worth noting. Both have rates above 59, and Texas alone produced 390,828 births in 2024—the second highest total in the country after California’s 402,075.
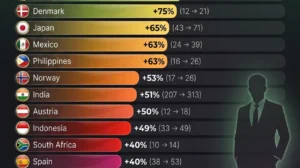
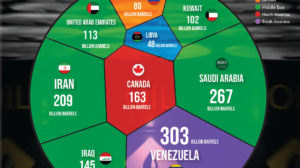
How Long It Took Countries to Reduce Fertility Rates from 6 to Below 3 Children
The Low-Rate States
The District of Columbia’s fertility rate of 39.8 is far below that of every state. D.C. has a large population of young professionals, high costs of living, and a smaller share of married couples with children compared to most states.
The entire Northeast cluster — Maine, New Hampshire, Massachusetts, Connecticut — posts rates between 45 and 49. This pattern matches what we see in many developed countries: urbanized, high-cost areas tend to have lower birth rates than rural or mid-sized communities.
Total Births: A Different Story
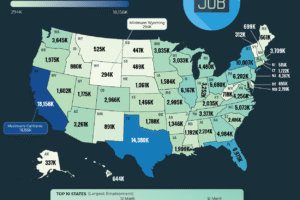
When looking at raw birth totals rather than rates, the picture shifts completely. California leads the entire country with 402,075 births, followed by Texas at 390,828. Together, those two states alone accounted for nearly 800,000 of the roughly 3.6 million births recorded across the U.S. in 2024. New York added another 205,489, and Florida added 224,389.
Meanwhile, states with some of the highest fertility rates — South Dakota (11,451), North Dakota (9,634), and Wyoming (6,089) — produced some of the smallest total numbers, simply because their populations are small.
The U.S. fertility rate as a whole has been declining steadily over the past two decades. In 2007, the national rate was above 69. By 2024, most states sit well below that level. Some economists view this as one of the defining economic challenges of the coming generation — not just for America, but for most developed nations.
Why Fertility Rates Matter for the Economy
Fertility rates are not just a health measure — they shape how a state’s economy grows and what pressures it faces over time. More births today mean more workers, taxpayers, and consumers in 20 years. Programmes like Social Security and Medicare depend on a steady flow of working-age people paying into the system.
States like Vermont and D.C., which have been sitting at the bottom of the fertility table for a long time, will face a shrinking young population and a growing share of retirees in the decades ahead — and that puts real pressure on state budgets. On the other side, higher birth rates drive demand for schools, childcare, and family housing, which creates jobs and keeps local economies moving.
Final Thoughts
The 2024 CDC data shows a snapshot of where births are happening across America — and where they are not. South Dakota and Nebraska are at the top, while the District of Columbia and Vermont sit at the bottom. Large states like California and Texas dominate in total birth numbers, but their fertility rates are not the largest. Overall, the latest U.S. fertility rate data provides an important look at the demographic and economic trends shaping the country’s future.