













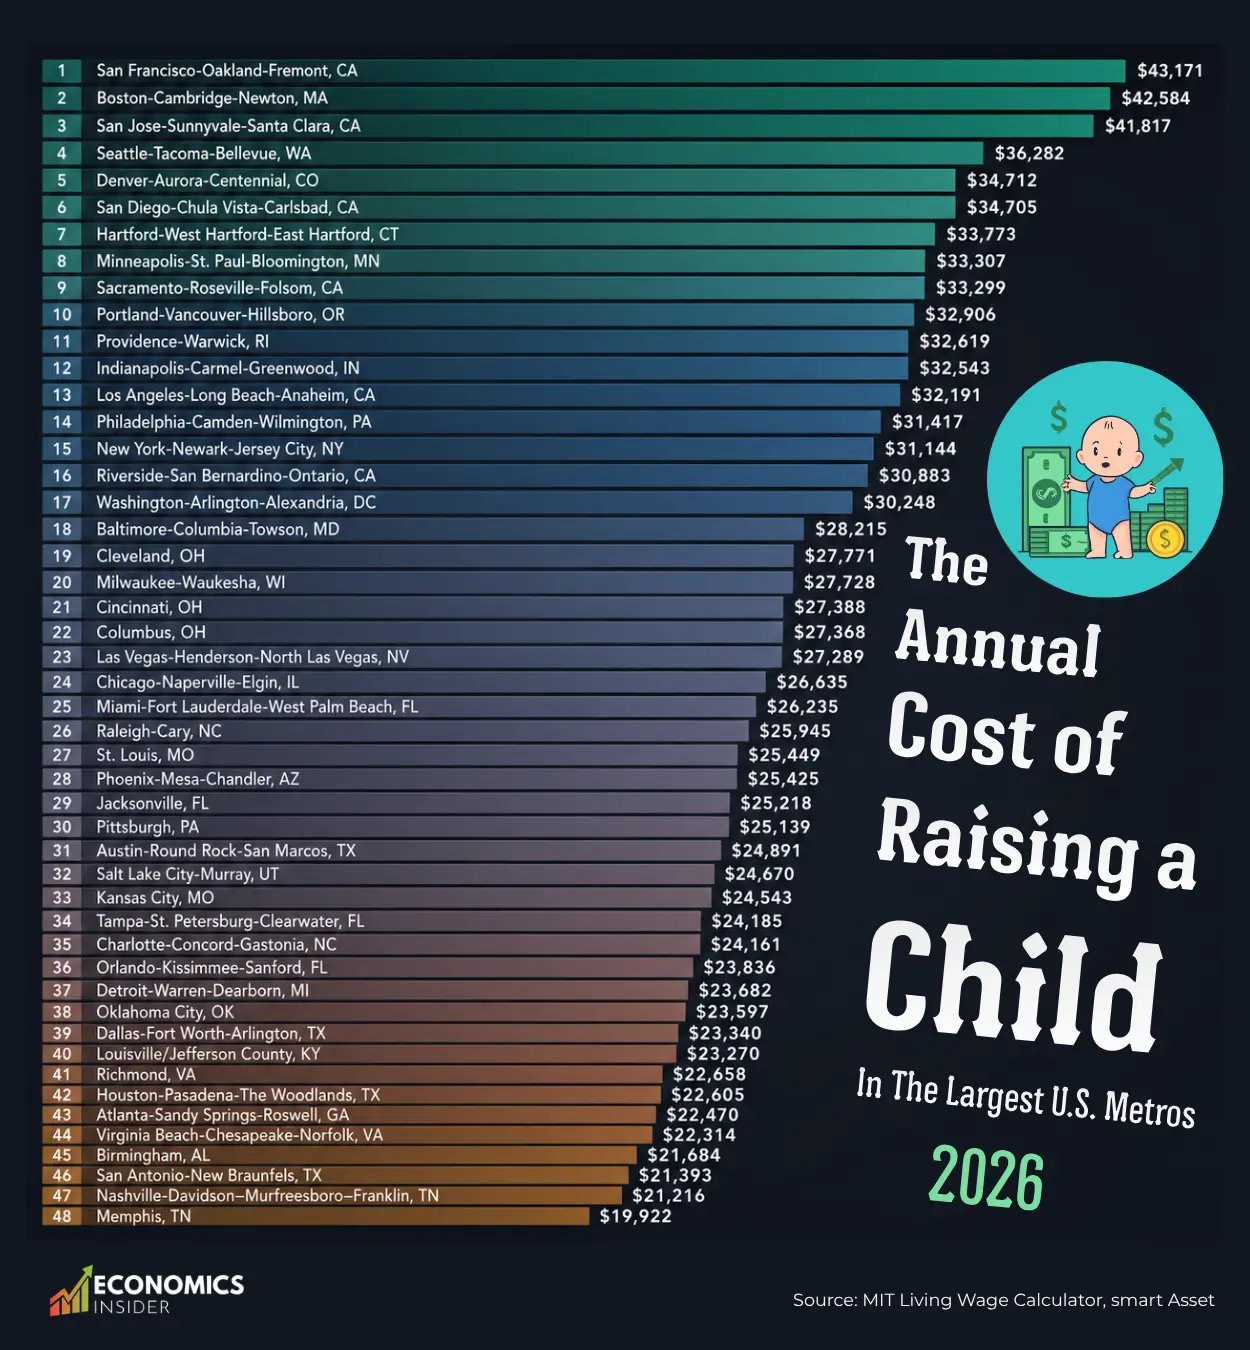
The Real Cost of Raising a Child is not the same everywhere in the United States. Where a family lives can make a major difference in how much it spends on childcare, food, housing, transportation, and other everyday needs. In some cities, parents are now spending more each year on a single child than many households spend on rent and groceries combined. In others, the number is still high but climbing much more slowly.
In 2026, the annual cost of raising a child ranges from more than $43,000 in the San Francisco area to less than $20,000 in Memphis. The difference between the most expensive and least expensive metro areas is more than $23,000 per year.
Smart Asset analyzed the annual child-rearing costs across 48 major U.S. metro areas for 2026, along with how much those costs have grown since 2025.
Key Takeaways
- San Francisco-Oakland-Fremont tops the list at $43,171 a year, nearly double the cost in Memphis, the most affordable metro at $19,922.
- Indianapolis saw the fastest cost increase of any metro, jumping 20.77% in a single year, even though its total cost remains far below the coastal cities.
- A handful of metros, including Richmond and Virginia Beach, saw costs fall slightly, bucking the national trend of rising expenses almost everywhere else.
Annual Cost to Raise a Child by Metro Area
The following table shows the annual cost of raising a child in 48 major U.S. metropolitan areas in 2026. The data is sourced from SmartAsset’s 2026 analysis of the annual cost of raising a child across U.S. metro areas.
| Rank | Metro Area | 2026 Annual Cost | Change 2025–2026 |
|---|---|---|---|
| 1 | San Francisco-Oakland-Fremont, CA | $43,171 | 10.75% |
| 2 | Boston-Cambridge-Newton, MA | $42,584 | 8.57% |
| 3 | San Jose-Sunnyvale-Santa Clara, CA | $41,817 | 10.43% |
| 4 | Seattle-Tacoma-Bellevue, WA | $36,282 | 5.32% |
| 5 | Denver-Aurora-Centennial, CO | $34,712 | 8.73% |
| 6 | San Diego-Chula Vista-Carlsbad, CA | $34,705 | 8.32% |
| 7 | Hartford-West Hartford-East Hartford, CT | $33,773 | 1.88% |
| 8 | Minneapolis-St. Paul-Bloomington, MN | $33,307 | 8.08% |
| 9 | Sacramento-Roseville-Folsom, CA | $33,299 | 10.25% |
| 10 | Portland-Vancouver-Hillsboro, OR | $32,906 | 9.02% |
| 11 | Providence-Warwick, RI | $32,619 | 9.10% |
| 12 | Indianapolis-Carmel-Greenwood, IN | $32,543 | 20.77% |
| 13 | Los Angeles-Long Beach-Anaheim, CA | $32,191 | 9.28% |
| 14 | Philadelphia-Camden-Wilmington, PA | $31,417 | 2.47% |
| 15 | New York-Newark-Jersey City, NY | $31,144 | 3.19% |
| 16 | Riverside-San Bernardino-Ontario, CA | $30,883 | 7.99% |
| 17 | Washington-Arlington-Alexandria, DC | $30,248 | 0.30% |
| 18 | Baltimore-Columbia-Towson, MD | $28,215 | 0.52% |
| 19 | Cleveland, OH | $27,771 | 6.70% |
| 20 | Milwaukee-Waukesha, WI | $27,728 | 10.33% |
| 21 | Cincinnati, OH | $27,388 | 7.15% |
| 22 | Columbus, OH | $27,368 | 5.84% |
| 23 | Las Vegas-Henderson-North Las Vegas, NV | $27,289 | 8.53% |
| 24 | Chicago-Naperville-Elgin, IL | $26,635 | 8.04% |
| 25 | Miami-Fort Lauderdale-West Palm Beach, FL | $26,235 | 9.37% |
| 26 | Raleigh-Cary, NC | $25,945 | 6.94% |
| 27 | St. Louis, MO | $25,449 | 4.66% |
| 28 | Phoenix-Mesa-Chandler, AZ | $25,425 | 4.14% |
| 29 | Jacksonville, FL | $25,218 | 10.69% |
| 30 | Pittsburgh, PA | $25,139 | 1.66% |
| 31 | Austin-Round Rock-San Marcos, TX | $24,891 | 2.91% |
| 32 | Salt Lake City-Murray, UT | $24,670 | 4.40% |
| 33 | Kansas City, MO | $24,543 | 6.05% |
| 34 | Tampa-St. Petersburg-Clearwater, FL | $24,185 | 10.55% |
| 35 | Charlotte-Concord-Gastonia, NC | $24,161 | 6.01% |
| 36 | Orlando-Kissimmee-Sanford, FL | $23,836 | 11.76% |
| 37 | Detroit-Warren-Dearborn, MI | $23,682 | 7.99% |
| 38 | Oklahoma City, OK | $23,597 | 3.29% |
| 39 | Dallas-Fort Worth-Arlington, TX | $23,340 | 4.49% |
| 40 | Louisville/Jefferson County, KY | $23,270 | 7.61% |
| 41 | Richmond, VA | $22,658 | -1.91% |
| 42 | Houston-Pasadena-The Woodlands, TX | $22,605 | 3.37% |
| 43 | Atlanta-Sandy Springs-Roswell, GA | $22,470 | 7.92% |
| 44 | Virginia Beach-Chesapeake-Norfolk, VA | $22,314 | -1.21% |
| 45 | Birmingham, AL | $21,684 | 13.64% |
| 46 | San Antonio-New Braunfels, TX | $21,393 | 2.14% |
| 47 | Nashville-Davidson–Murfreesboro–Franklin, TN | $21,216 | 2.06% |
| 48 | Memphis, TN | $19,922 | 3.42% |
Why the Coasts Cost So Much More
The Real Cost of Raising a Child in San Francisco, Boston, and San Jose sit at the top of the list. These are metros where housing eats up a huge chunk of every family’s budget before childcare, food, or healthcare even enter the picture. When a two-bedroom apartment alone can run several thousand dollars a month, the cost of adding a child on top of that rent gets pushed higher across the board.
Daycare centers, pediatricians, and after-school programs in these cities also charge more simply because their own rent and staffing costs are higher. It’s a chain reaction that starts with housing and touches everything else a family needs to pay for.
Major Metros With the Highest Cost of Raising a Child
The most expensive places to raise a child are concentrated mainly along the West Coast and in the Northeast.
San Francisco-Oakland-Fremont ranks first, at $43,171 per year. That is more than $3,500 higher than the second-ranked metro, Boston. The San Francisco area also saw its cost rise by 10.75% from 2025 to 2026.
Boston-Cambridge-Newton follows at $42,584 per year. Its annual cost increased by 8.57% over the previous year.
San Jose-Sunnyvale-Santa Clara ranks third at $41,817. Like San Francisco, the San Jose area has a particularly high cost of living, and the cost of raising a child increased by 10.43% in one year.
Other expensive West Coast metros include Seattle-Tacoma-Bellevue, where the annual cost reaches $36,282, and San Diego-Chula Vista-Carlsbad, at $34,705.
Several other California metros also appear high on the list. Sacramento has an annual cost of $33,299, while Los Angeles reaches $32,191 and Riverside reaches $30,883.
The Northeast also has several expensive locations. Providence costs about $32,619 per year, while Philadelphia comes in at $31,417. New York is slightly lower at $31,144.
Interestingly, being a major city does not automatically mean it is among the most expensive. New York, for example, ranks 15th, while Chicago ranks 24th at $26,635 per year.
Salary Needed to Live Comfortably in U.S. Cities, 2026
Major Metros With the Lowest Cost of Raising a Child
The lower end of the ranking includes many metros in the South and Midwest. These areas generally have lower annual costs than the most expensive coastal cities.
Memphis is the least expensive metro in the data, with an annual cost of $19,922. That is less than half the cost recorded in San Francisco.
Nashville-Davidson–Murfreesboro–Franklin is another relatively affordable major metro, at $21,216 per year. Birmingham follows at $21,684, while San Antonio comes in at $21,393.
Texas has several metros toward the lower end of the ranking. Houston costs $22,605 per year, while Dallas-Fort Worth comes in at $23,340. Austin is somewhat more expensive at $24,891.
Other relatively affordable metros include Oklahoma City, at $23,597, and Louisville, at $23,270.
Florida also has several metros below the national high-cost group. Jacksonville has an annual cost of $25,218, while Orlando costs $23,836 and Tampa costs $24,185.
The Midwest has some relatively low-cost options as well. Detroit comes in at $23,682, while Kansas City costs $24,543. Pittsburgh is at $25,139, and St. Louis is at $25,449.
These figures show that families do not necessarily need to move to a small city to find lower costs. Several large metropolitan areas still have annual child-raising costs below $25,000.
A Regional Breakdown
Looking at these metros by region makes the pattern even clearer.
The West Coast is in a league of its own. California alone places six metros in this dataset, and every single one of them lands in the top sixteen most expensive. San Francisco, San Jose, San Diego, Sacramento, Los Angeles, and Riverside are all above $30,000 a year. Add in Seattle and Portland, and the entire West Coast is long stretch of high-cost cities for families.
The Mountain West and Upper Midwest sit in the middle. Denver, Minneapolis, and Salt Lake City aren’t cheap, and several of them posted some of the bigger increases on the list. Denver rose 8.73% and Minneapolis 8.08%, both faster than many pricier coastal metros.
The South is where the affordability still lives. Texas, Tennessee, Alabama, and much of the Southeast dominate the bottom half of the list. But affordability doesn’t mean stability everywhere. Birmingham jumped 13.64% and Orlando rose 11.76%, both among the steepest increases nationally, even though their total costs remain well below the coastal metros.
The Metros Bucking the Trend
While the cost of raising a child rose almost everywhere, a few metros actually got slightly cheaper. Richmond fell by 1.91% and Virginia Beach dropped 1.21%. Washington DC and Baltimore, meanwhile, barely moved at all, with increases under 1%.
On the other hand, At $32,543 a year, Indianapolis isn’t even in the top ten most expensive metros. But its year-over-year jump of 20.77% is by far the steepest increase anywhere on the list.
The Bottom Line
The gap between the most and least expensive metros is more than $23,000 a year. This is a bigger difference than many people’s entire annual childcare budget in lower-cost cities. A high-paying job in San Francisco can be quietly offset by child-rearing costs that are more than double what the same family would pay in Memphis or San Antonio.
As housing costs keep climbing in major metros, the cost of raising a child climbs right along with it. And in cities like Indianapolis, that climb can happen fast enough to catch local families off guard.