


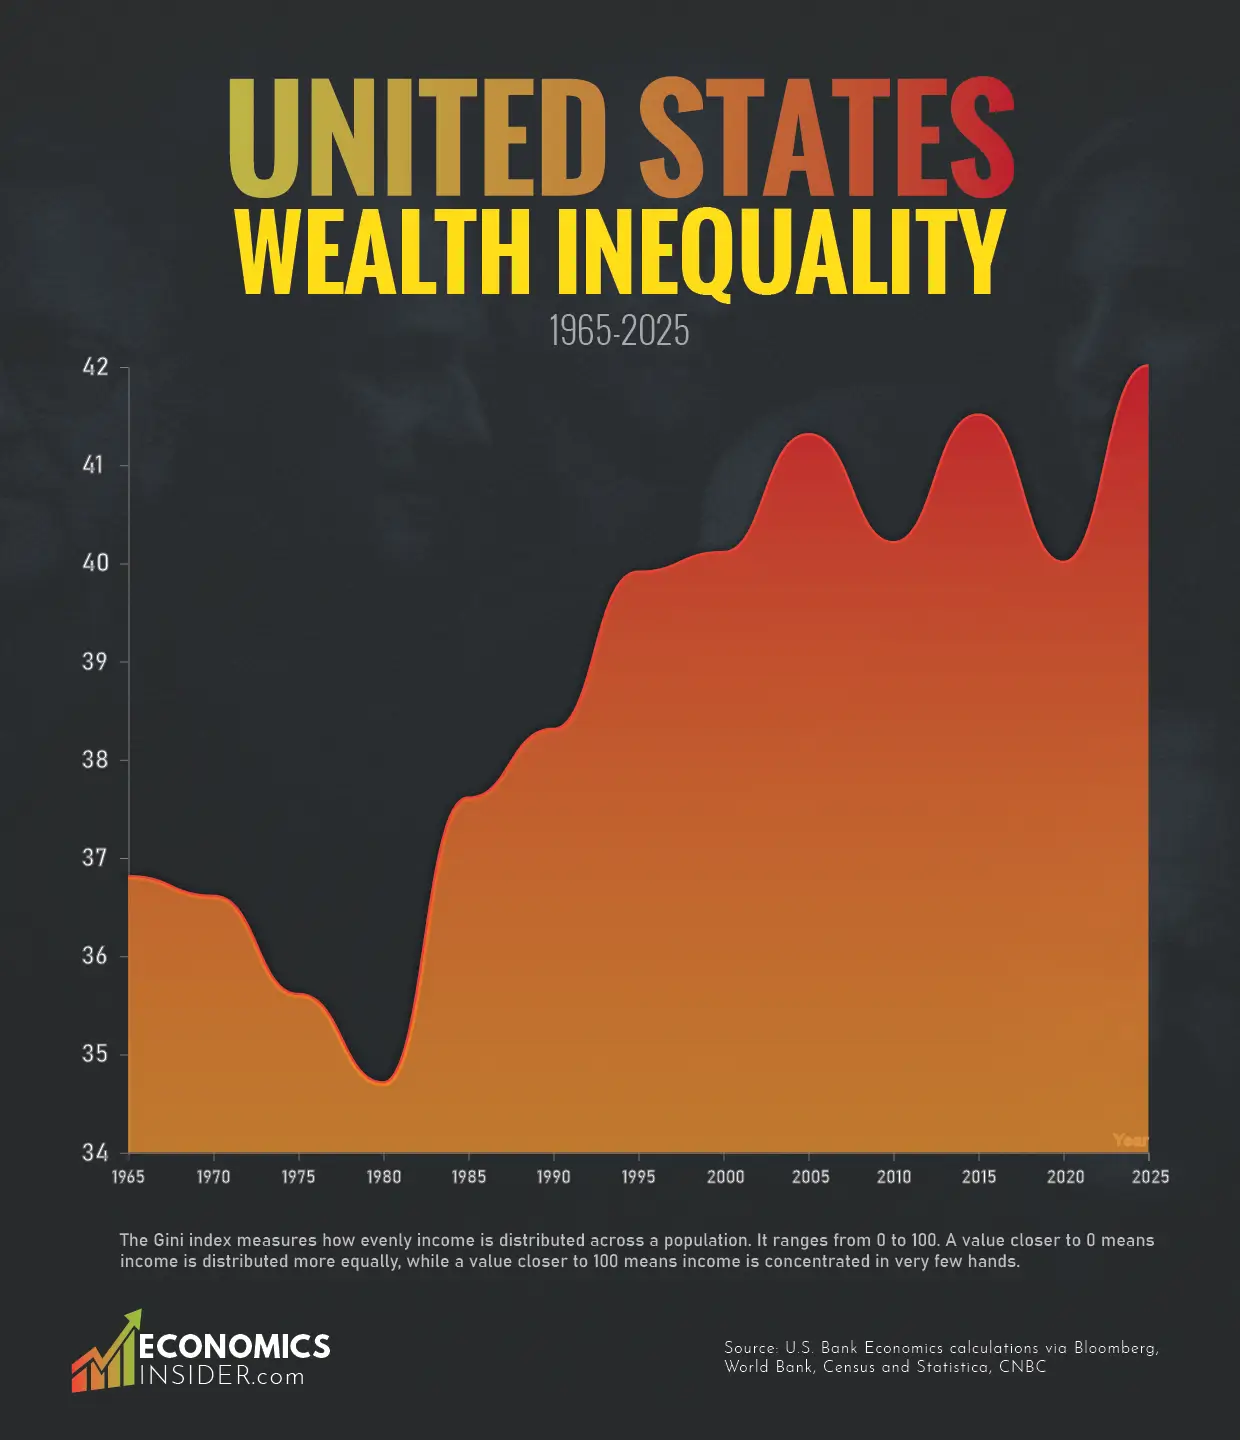
Wealth inequality and the so-called “K-shaped” economy are more striking than ever in the United States. Income inequality in the United States has moved up and down over the last sixty years. After being relatively low in the 1960s and 1970s, inequality began rising sharply from the 1980s onward. By 2025, it reached its highest level in modern U.S. history.
This growing divide can be seen clearly in wealth ownership. According to the Federal Reserve, the net worth of America’s top 1% reached a record share of nearly 32% of total U.S. wealth in the third quarter of 2025. In contrast, the bottom 50% of Americans together held only about 2.5% of total net wealth. This shows how heavily wealth has become concentrated at the very top of U.S. society.
How Economists Measure Income Inequality
To track income inequality over time, economists often use the Gini index. The Gini index measures how evenly income is distributed across a population. It ranges from 0 to 100. A value closer to 0 means income is distributed more equally, while a value closer to 100 means income is concentrated in very few hands. In the U.S., the Gini index rising over time means that income and wealth are increasingly flowing to high earners, while the majority see much slower gains.
Key Takeaways
- U.S. wealth inequality was lowest around 1980 and has mostly risen since then.
- Technology, finance, and asset ownership have played a major role in widening the gap.
- By 2025, income and wealth in the U.S. became more concentrated than at any time in the past six decades.
U.S. Wealth Inequality (1965-2025)
The following table shows changes in the U.S. Gini index from 1965 to 2025.
| Year | Gini Coefficient |
|---|---|
| 1965 | 36.8 |
| 1970 | 36.6 |
| 1975 | 35.6 |
| 1980 | 34.7 |
| 1985 | 37.6 |
| 1990 | 38.3 |
| 1995 | 39.9 |
| 2000 | 40.1 |
| 2005 | 41.3 |
| 2010 | 40.2 |
| 2015 | 41.5 |
| 2020 | 40 |
| 2025 | 42 |
Source: U.S. Bank Economics calculations via Bloomberg, World Bank, CNBC
1965–1980: A More Equal America
In 1965, the U.S. Gini index stood at 36.8. By 1975, it had fallen to 35.6. This period is characterized by shared economic growth in America. Jobs in manufacturing were plentiful, labor unions were powerful, and workers could enjoy middle-class incomes without requiring a college education.
Additionally, government policies and progressive taxation helped alleviate inequality. During these years, economic growth benefited a wider portion of the population. As a result, income inequality in the U.S. declined slightly.
By 1980, the Gini index reached its lowest level of the entire period at 34.7. However, the U.S. economy was under stress. Inflation rates were high, energy prices were up, and economic growth slowed. Although inequality levels were low, the economic system was becoming unstable.
1980–1990: A Major Shift Begins
From 1980 to 1990, U.S. income inequality rose sharply from 34.7 to 38.3. This decade marked a turning point. Tax cuts favored high earners, financial markets expanded, and labor unions weakened. Manufacturing jobs declined as companies moved production abroad. At the same time, executive pay and high-income salaries grew rapidly.
For many American workers, wages stopped keeping up with productivity. This decade laid the foundation for the long-term rise in inequality that followed.
1990–2000: Globalization and the Tech Boom
Between 1990 and 2000, the Gini index increased from 38.3 to 40.1. The U.S. economy became more globalized. Trade expanded, and companies benefited from lower costs overseas. Technology companies began to grow rapidly, especially in software and the internet.
Stock markets performed strongly, which boosted incomes for investors and wealthy households. However, many workers saw only modest wage growth. The income gap continued to widen across the country.
How Billionaires and Their Wealth Changed from 2024 to 2025
2000–2015: Financial Growth and Crisis
From 2000 to 2005, inequality rose to 41.3 as housing prices and financial markets surged. Then, the financial crisis of 2008 occurred. Millions of Americans lost jobs and homes. This led to a slight reduction in inequality to 40.2 by 2010. However, this was short-lived. Wealthy households recovered faster because they owned stocks and other assets that rebounded quickly. Lower-income Americans suffered more long-lasting damage, thereby keeping inequality high.
Between 2010 and 2015, U.S. income inequality climbed again to 41.5. The economic recovery benefited the owners of assets mostly. For example, stock prices skyrocketed, while average workers experienced slow wages. Jobs were available, albeit unstable. Technology companies gained more power, and wealth became more concentrated among the company founders and shareholders.
2015–2025: A Small Dip, Big Problems Remain
The Gini index decreased slightly to 40.0 by 2020. Government support and temporary wage gains lessened inequality, but major structural problems remained. Housing costs went up, health care became more expensive, and many Americans struggled to build wealth. The underlying system continued to favor asset owners over wage earners.
By 2025, U.S. income inequality reached 42, the highest level in the last six decades. The rise of AI, big tech, and digital platforms created enormous wealth at the top. Stock markets and asset prices surged, while wages failed to keep up with living costs for many Americans.
According to the Federal Reserve, the top 1% now control nearly one-third of all U.S. wealth, while the bottom half owns only a tiny share. This period represents an extreme concentration of income and wealth in modern America.
Conclusion
From 1965 to 2025, income inequality in the U.S. showed a clear trend. Inequality tended to increase steadily over more than four decades, starting from a trough in 1980. Changes in policy, globalization, the role of financial markets, and technology all played major roles in increasing inequality.