











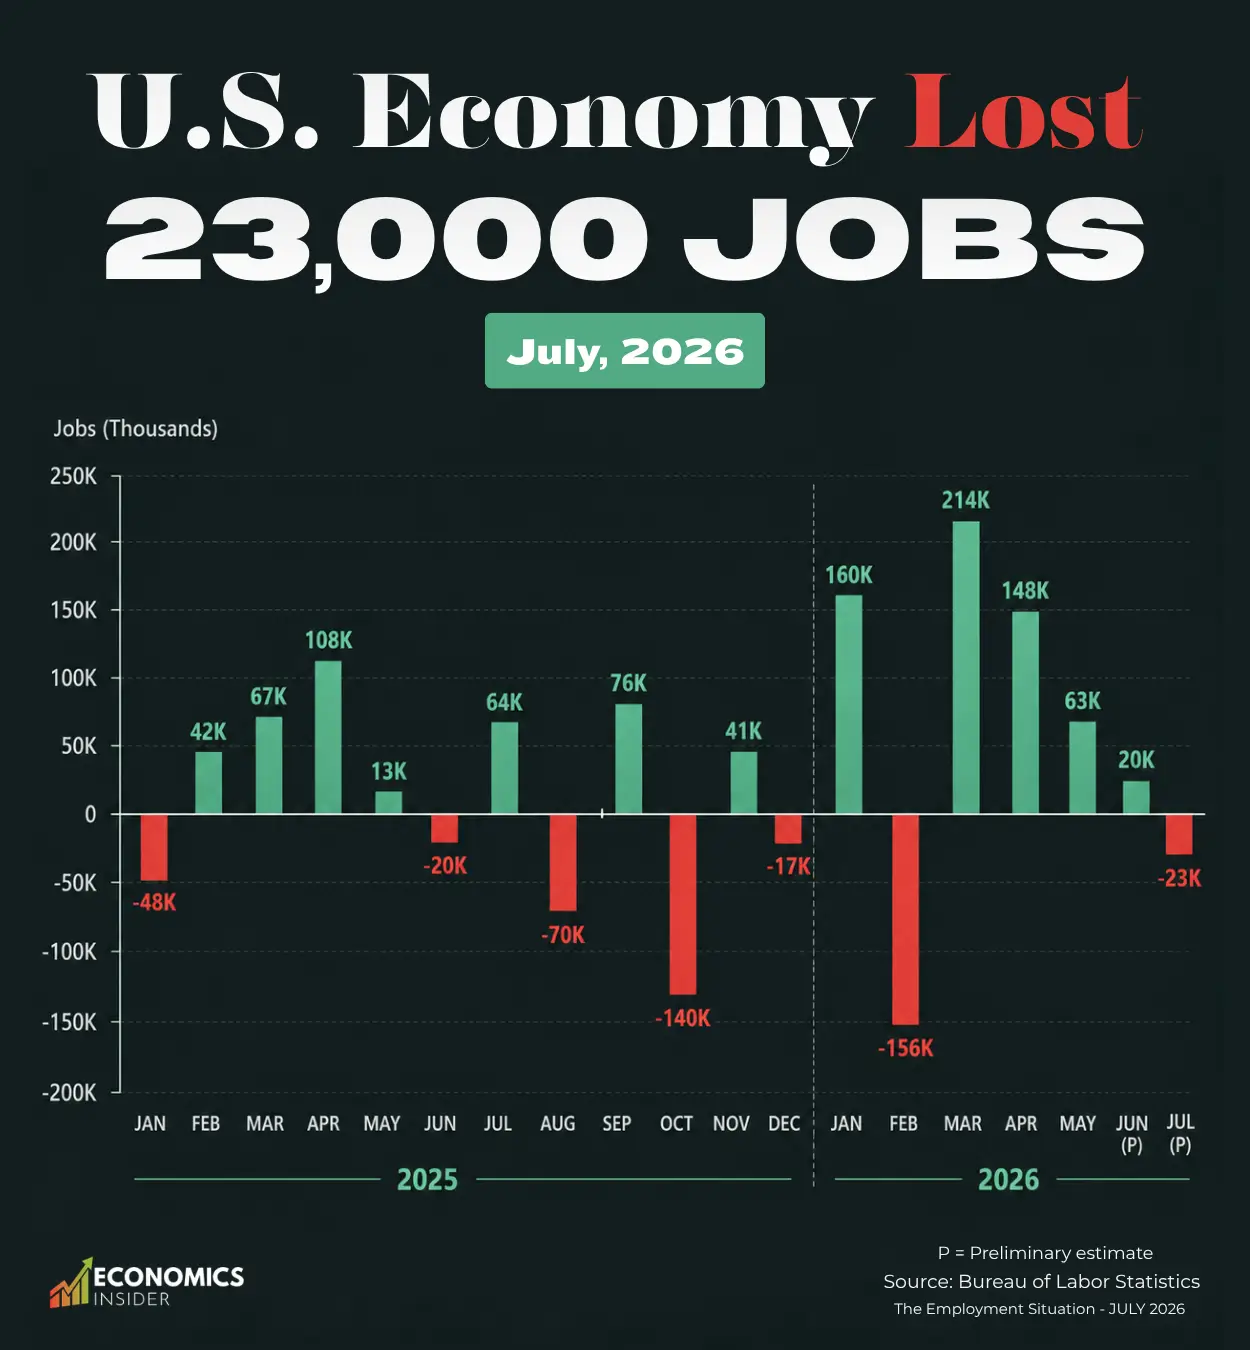
The U.S. labor market took an unexpected step backward in July, with employers cutting 23,000 jobs instead of adding workers. The bigger concern is that the weakness was not limited to July: the Bureau of Labor Statistics also sharply revised down job growth for May and June by a combined 103,000 jobs.
At the same time, the unemployment rate fell to 4.1%, showing that the latest report is weaker than the headline unemployment number might suggest.
Key Takeaways
- U.S. employers lost 23,000 jobs in July, the first monthly decline in this year’s data.
- May and June were much weaker than previously reported, with their combined job gains reduced by 103,000.
- The unemployment rate fell to 4.1%, but the labor market has been losing momentum.
U.S. Monthly Job Creation
The table below shows the monthly change in total nonfarm payroll employment. The figures are measured in thousands of jobs and are seasonally adjusted.
| Month | 2025 | 2026 |
|---|---|---|
| January | −48K | +160K |
| February | +42K | −156K |
| March | +67K | +214K |
| April | +108K | +148K |
| May | +13K | +63K |
| June | −20K | +20K (P) |
| July | +64K | −23K (P) |
| August | −70K | — |
| September | +76K | — |
| October | −140K | — |
| November | +41K | — |
| December | −17K | — |
P = Preliminary estimate.
The data comes from the U.S. Bureau of Labor Statistics (BLS) Employment Situation report. The BLS collects employment information through its monthly establishment survey, which covers nonfarm payroll jobs across the U.S. The figures can be revised in later reports as the BLS receives additional information from businesses and government agencies.
July Was a Weak Month for Jobs
The July report was released on August 7, and the headline number was difficult to ignore. Instead of adding jobs, the U.S. economy lost 23,000 nonfarm payroll jobs during the month. The result was weaker than the recent pace of hiring, with payroll employment having increased by an average of only 34,000 jobs per month over the previous 12 months.
This is important because the labor market had already been showing signs of slowing. July did not simply represent another month of weak hiring.
Previous Job Gains Were Revised Sharply Lower
One of the most important parts of the July report was not actually July’s −23,000 figure. The BLS revised May’s job gain from 129,000 to 63,000. June was also revised from 57,000 to just 20,000. That means May and June together produced 103,000 fewer jobs than previously reported.
| Month | Previous estimate | July revised estimate | Revision |
| May 2026 | +129K | +63K | −66K |
| June 2026 | +57K | +20K | −37K |
| Combined | +186K | +83K | −103K |
Where Did Jobs Disappear in July?
The losses were concentrated in a few areas.
Local government education lost 50,000 jobs, making it the largest decline in the report. Employment in this area had shown little overall change during the previous year.
Retail trade lost 19,000 jobs. Within retail, warehouse clubs, supercenters and other general merchandise stores lost 21,000 jobs, while gasoline stations and fuel dealers lost another 5,000. Some of those losses were partly offset by gains among sporting goods, hobby, musical instrument, book and miscellaneous retailers.
Financial activities also continued to lose jobs, falling by 14,000 in July. Employment in the sector is now down by 121,000 jobs from its recent peak in May 2025.
There were also some areas of Jobs gain.
Health care added 22,000 jobs, continuing its long-running trend of employment growth. However, even here the pace was slower than the previous year’s average monthly gain of 36,000.
Several other major industries, including construction, manufacturing, transportation, professional and business services, leisure and hospitality, and social assistance, showed little change during the month.
The Unemployment Rate Fell
The unemployment rate fell from 4.2% in June to 4.1% in July. The number of unemployed people was about 6.9 million. But the broader numbers give a more cautious picture. The labor force participation rate fell to 61.4% in July. Since January, it has declined by 0.7 percentage point. The employment-population ratio has also fallen by 0.5 percentage point since January.
In simple terms, fewer people are participating in the labor market than at the beginning of the year. That matters because the unemployment rate only counts people who are unemployed and actively looking for work. Someone who wants a job but is no longer actively searching is not counted as unemployed.
The July report showed 5.9 million people outside the labor force who currently wanted a job, although that number changed little during the month.
So the 4.1% unemployment rate should not be read as evidence that the labor market is getting stronger on its own.
Wage Growth Is Still Positive
There was at least some stability in wages. Average hourly earnings for private-sector workers reached $37.62 in July, up just 2 cents from the previous month. Over the past year, average hourly earnings increased by 3.2%.
The average workweek also remained unchanged at 34.3 hours.
What the July Jobs report Tell Us About the U.S. Economy
The monthly job gains in 2026 have been highly uneven. January produced a 160,000 increase, February saw a 156,000 decline, and March and April brought strong gains of 214,000 and 148,000. But since then, hiring has slowed sharply: 63,000 jobs in May, 20,000 in June after revision, and −23,000 in July.
The pattern suggests that businesses have become more cautious about adding workers. And the revisions make the slowdown look even clearer. The BLS now estimates that payroll employment grew by only 34,000 jobs per month on average over the previous 12 months.
The Bottom Line
The July jobs report was not simply about the U.S. losing 23,000 jobs. The more important story is that the labor market appears to have been weaker than previously thought. May and June were revised down by a combined 103,000 jobs, July produced another decline, and the average pace of job growth over the previous year has fallen to just 34,000 jobs per month.