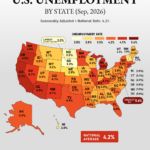

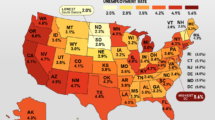









The U.S. national unemployment rate held at 4.2% in September, almost unchanged from August. It has remained within a fairly narrow range for much of 2026. But the national figure tells only part of the story. Unemployment looks quite different from one state to another.
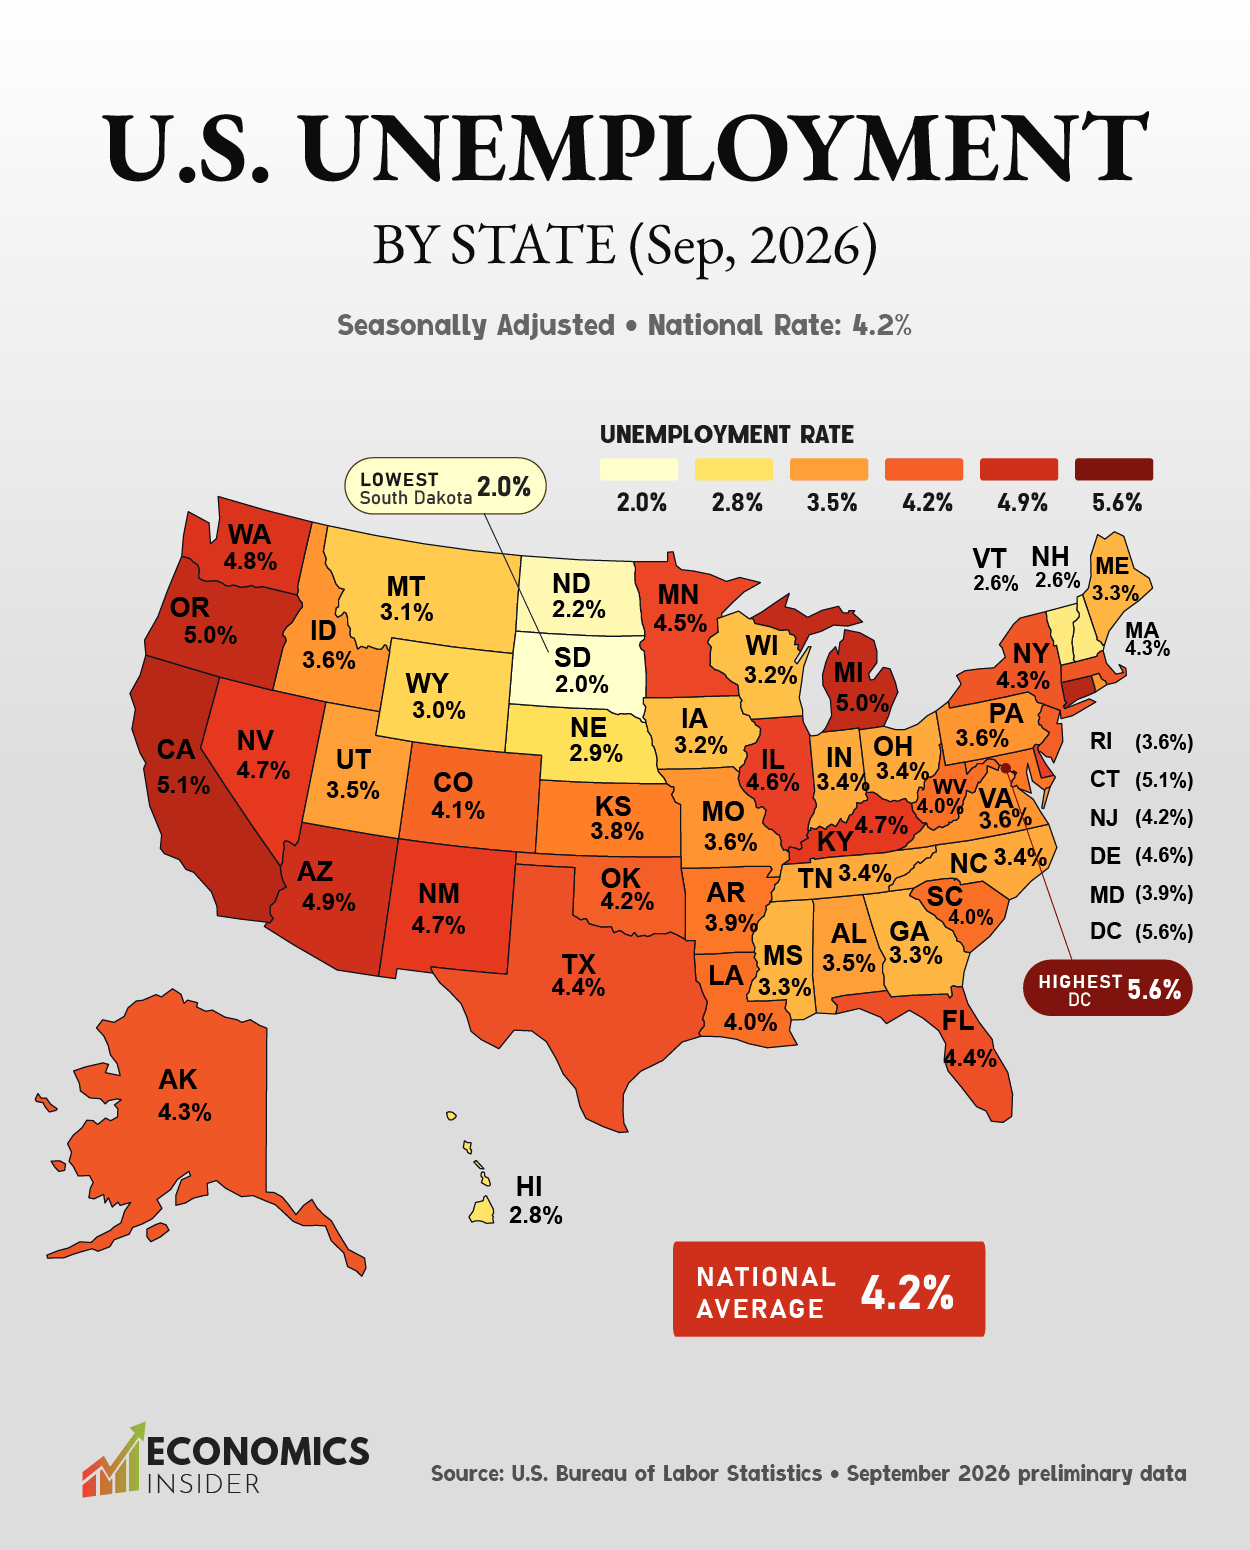
South Dakota had the lowest unemployment rate in the country at 2.0%. North Dakota was next at 2.2%, then New Hampshire and Vermont at 2.6% each, and Hawaii at 2.8%. None of that is new. These states have consistently ranked among those with the lowest unemployment rates in recent months.
The District of Columbia recorded the highest unemployment rate at 5.6%. California and Connecticut were both at 5.1%, Michigan and Oregon at 5.0%, Arizona at 4.9%, and Washington at 4.8%. The gap between the lowest and highest rates was 3.6 percentage points, which is a big difference in what job hunting actually feels like depending on where you live.
Key Takeaways
- The Dakotas still have some of the tightest job markets in the country, well under the national rate.
- California, Connecticut, Michigan, and Oregon have the highest unemployment rates.
Unemployment Across U.S. States, September 2026
The following table shows unemployment rates across U.S. states and the District of Columbia in September 2026. The data is sourced from the U.S. Bureau of Labor Statistics (BLS).
| State | September 2026 Unemployment Rate |
|---|---|
| South Dakota | 2.0% |
| North Dakota | 2.2% |
| New Hampshire | 2.6% |
| Vermont | 2.6% |
| Hawaii | 2.8% |
| Nebraska | 2.9% |
| Wyoming | 3.0% |
| Montana | 3.1% |
| Iowa | 3.2% |
| Wisconsin | 3.2% |
| Georgia | 3.3% |
| Maine | 3.3% |
| Mississippi | 3.3% |
| Indiana | 3.4% |
| North Carolina | 3.4% |
| Ohio | 3.4% |
| Tennessee | 3.4% |
| Alabama | 3.5% |
| Utah | 3.5% |
| Idaho | 3.6% |
| Missouri | 3.6% |
| Pennsylvania | 3.6% |
| Rhode Island | 3.6% |
| Virginia | 3.6% |
| Kansas | 3.8% |
| Arkansas | 3.9% |
| Maryland | 3.9% |
| Louisiana | 4.0% |
| South Carolina | 4.0% |
| West Virginia | 4.0% |
| Colorado | 4.1% |
| New Jersey | 4.2% |
| Oklahoma | 4.2% |
| Alaska | 4.3% |
| Massachusetts | 4.3% |
| New York | 4.3% |
| Florida | 4.4% |
| Texas | 4.4% |
| Minnesota | 4.5% |
| Delaware | 4.6% |
| Illinois | 4.6% |
| Kentucky | 4.7% |
| Nevada | 4.7% |
| New Mexico | 4.7% |
| Washington | 4.8% |
| Arizona | 4.9% |
| Michigan | 5.0% |
| Oregon | 5.0% |
| California | 5.1% |
| Connecticut | 5.1% |
| District of Columbia | 5.6% |
States where unemployment remains low
At 2.0%, South Dakota is less than half the national average of 4.2%. North Dakota isn’t far behind at 2.2%. Energy, agriculture, and manufacturing play important roles in these states’ economies.
Parts of New England are doing well too. New Hampshire and Vermont both came in at with unemployment rate of 2.6%, and Maine was at 3.3%. Out west, Wyoming (3.0%) and Montana (3.1%) were also under the national rate, and so was Iowa at 3.2%.
So even with the national job market cooling a bit, plenty of places still have very little unemployment.
US Jobs Report August 2026: 162,000 Jobs Added as Unemployment Holds at 4.1%
Where unemployment remains high
The bigger states look worse. California and Connecticut hit unemployment rate of 5.1% in September, almost a full point above the national rate. California matters most because of its size. With a workforce that large, even a modestly higher rate touches millions of people.
Michigan and Oregon were close behind at 5.0%, with Arizona at 4.9% and Washington at 4.8%. D.C. topped everything at 5.6% unemployment rate, though it’s a bit of an odd case since its economy leans heavily on federal jobs alongside the private sector.
A high rate doesn’t mean every industry in a state is struggling, and conditions can differ a lot from one region of a state to another. Still, someone looking for work in these places is likely facing more competition than someone in the Dakotas.
The middle of the pack
Most states land somewhere between those extremes. Texas and Florida were both sit at unemployment rate of 4.4%. Illinois and Delaware were higher at 4.6%. Georgia, Ohio, Indiana and Tennessee were all around 3.3% to 3.4%.
A gap of a point or two looks small on paper, but it adds up. In a state near 3%, far fewer people in the labor force are out of work than in one near 5%.
The Bottom Line
The national unemployment rate stayed at 4.2%, but some states were under 3% while others topped 5%. The lowest rates were in the Dakotas and parts of New England, and the highest were in California, Connecticut, Michigan, Oregon and D.C.
For workers, that can change everything. In low-unemployment states, employers are competing for people. In high-unemployment states, it’s the job seekers who face the competition.
Credit: US Map base: amCharts