


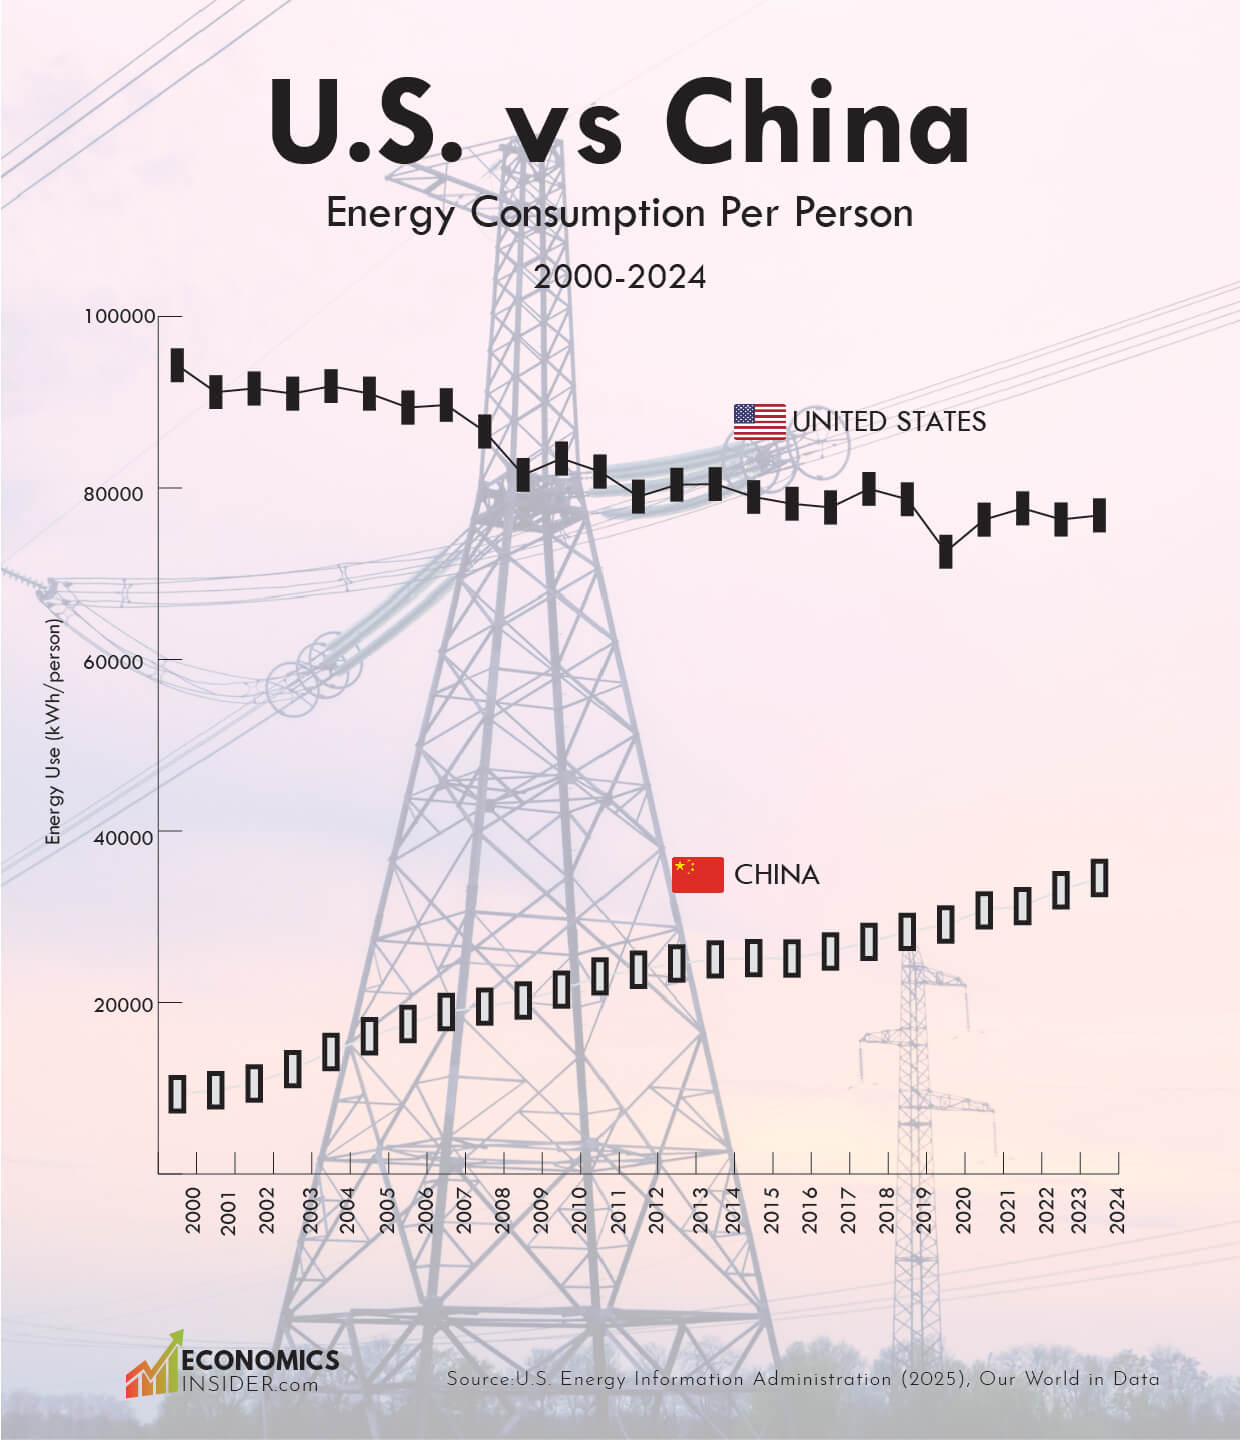
The United States and China are the two biggest economies in the world, and both use a huge amount of energy every day. But from 2000 to 2024, their energy use looked very different. The U.S. started the century with very high energy use per person. Since then, the changes have been smaller, going up and down with the economy and with improvements in saving energy. China, on the other hand, started with much lower energy use per person but saw a fast increase as its economy grew, more people moved to cities, and industries expanded.
Key Takeaways
- The U.S. still uses much more energy per person than China, but the gap between the two largest economies is getting smaller.
- China’s sharp rise in energy use per person is mainly due to rapid urbanization and economic development.
Comparing U.S. and China’s Per Capita Energy Use (2000–2024)
The following table compares the per capita energy consumption of the United States and China from 2000 to 2024.
| Year | 🇺🇸 U.S. Energy Use (kWh/person) | 🇨🇳 China Energy Use (kWh/person) |
|---|---|---|
| 2000 | 94308 | 9294 |
| 2001 | 91172 | 9751 |
| 2002 | 91601 | 10553 |
| 2003 | 91005 | 12219 |
| 2004 | 91872 | 14214 |
| 2005 | 91007 | 16050 |
| 2006 | 89378 | 17486 |
| 2007 | 89671 | 18893 |
| 2008 | 86589 | 19508 |
| 2009 | 81521 | 20229 |
| 2010 | 83435 | 21497 |
| 2011 | 81912 | 23037 |
| 2012 | 78985 | 23821 |
| 2013 | 80374 | 24548 |
| 2014 | 80453 | 25021 |
| 2015 | 78949 | 25166 |
| 2016 | 78155 | 25125 |
| 2017 | 77729 | 25949 |
| 2018 | 79893 | 27068 |
| 2019 | 78683 | 28231 |
| 2020 | 72562 | 29095 |
| 2021 | 76307 | 30738 |
| 2022 | 77627 | 31235 |
| 2023 | 76326 | 33089 |
| 2024 | 76799 | 34514 |
Source: U.S. Energy Information Administration (2025), Our World in Data, Statistical Review of World Energy (2025)
Comparing U.S. and China’s Energy Use
In the year 2000, the average American used about 94,300 kilowatt-hours (kWh) of energy. At the same time, the average Chinese citizen used just about 9,300 kWh. This meant one American consumed nearly ten times more energy than one Chinese person.
Fast forward to 2024, and the situation looks very different. The average American now uses about 76,800 kWh, while the average Chinese person uses around 34,500 kWh. That’s still a big gap, but much smaller than before. Over this period, China’s per person energy use almost quadrupled, while U.S. use actually fell slightly.
The U.S. energy consumption shows ups and downs. Energy use dropped after the 2008 financial crisis and again in 2020 during the COVID-19 pandemic, when industries slowed and people stayed home. China’s numbers, however, moved mostly in one direction — upward. This steady rise reflects its rapid economic growth, industrialization, and urbanization.
Rapid Growth Pushes Up China’s Energy Use
China’s energy consumption rise is mainly due to its transformation to modern country with quality infrastructure. Over the past two decades, hundreds of millions of people moved from the countryside into cities. Urban households started using more appliances, heating, and cooling. Millions of people bought cars. At the same time, China built vast amounts of infrastructure: highways, railways, factories, and new housing. All of these required huge amounts of energy.
Industries played a big role as well. China became the “world’s factory,” producing everything from steel and cement to electronics and clothing. These industries are energy-hungry, and they pushed the country’s energy use higher year after year.
U.S. Still Uses More Energy Per Person Than China
By 2000, the U.S. already had modern infrastructure, developed industries, and widespread household energy use. Growth in per person energy use slowed because much of the big building phase was long over.
Instead, efficiency became the key story. Better home insulation, more fuel-efficient cars, and improved appliances meant people could do the same things with less energy. At the same time, some of the most energy-intensive industries moved overseas, which lowered U.S. demand.
U.S. and China Merchandise Exports as a Share of GDP (1991-2014)
The financial crisis in 2008 and the COVID pandemic in 2020 both cut energy use sharply. After each dip, there was some recovery, but not enough to push per person use above early 2000s levels.
How Energy Use Is Measured
The data is for primary energy consumption per person. That includes all kinds of energy: electricity, transport fuels, heating, and industry. It’s not just about how much electricity people use at home.
If we focus only on electricity, the picture is slightly different. In 2024, China’s electricity use per person was around 7,100 kWh. This is still below U.S. levels, but much higher than at the start of the century, when it was just a fraction of that.
China still uses a lot of coal, which makes up a large part of its power generation. But it has also become the world leader in building renewable energy, especially solar and wind.
Both the U.S. and China face the same big challenge: how to keep their economies growing while cutting down pollution from greenhouse gases.
Conclusion
The gap between U.S. and China’s energy use per person shows their different stages of economic development. In 2000, the U.S. already had high living standards, and modern infrastructure. That explains why its per person energy use was so high. China, by contrast, was still an industrializing country, with many people living in rural areas and using far less energy.
By 2024, China had narrowed the gap thanks to rising incomes, urban lifestyles, and industrial expansion. Yet the U.S. still uses more than twice as much energy per person. This shows how much room China still has to grow in terms of energy demand — unless efficiency and renewables slow that rise.


Add Comment