

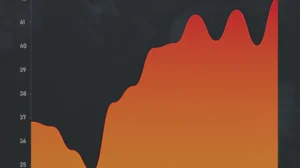
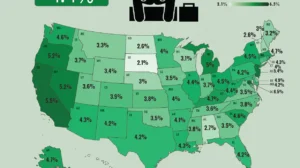


In 2025, the U.S. unemployment rate stood at approximately 4.4%. Historically, unemployment has reached much higher levels during major economic downturns. In 1982, it peaked at about 10% during the early-1980s recession, and it returned to a similar level in October 2009 amid the Great Recession. The sharpest increase occurred in April 2020, when unemployment surged to roughly 14.7%.
After this historic surge, the job market steadily improved, and unemployment moved lower in the following years. By 2025, the unemployment rate had settled around the mid-4% range. In 2026, it is expected to remain at similar levels based on current forecasts.
Key Takeaways
- The US unemployment forecast shows a mild rise to the mid-4% range in the near term. It is closer to a normal or slightly soft labor market.
- The highest unemployment rates in recent US history were the pandemic peak (about 14.7% in April 2020) and the Great Recession peak (~10% in 2009).
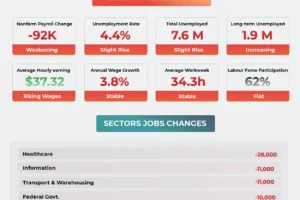
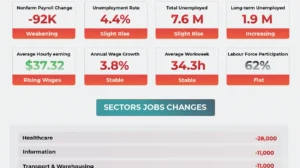
- Layoff announcements in 2025 have been unusually large. According to Challenger, Gray & Christmas, more than one million job cuts were announced through November 2025.
Forecast of the Unemployment Rate in the United States
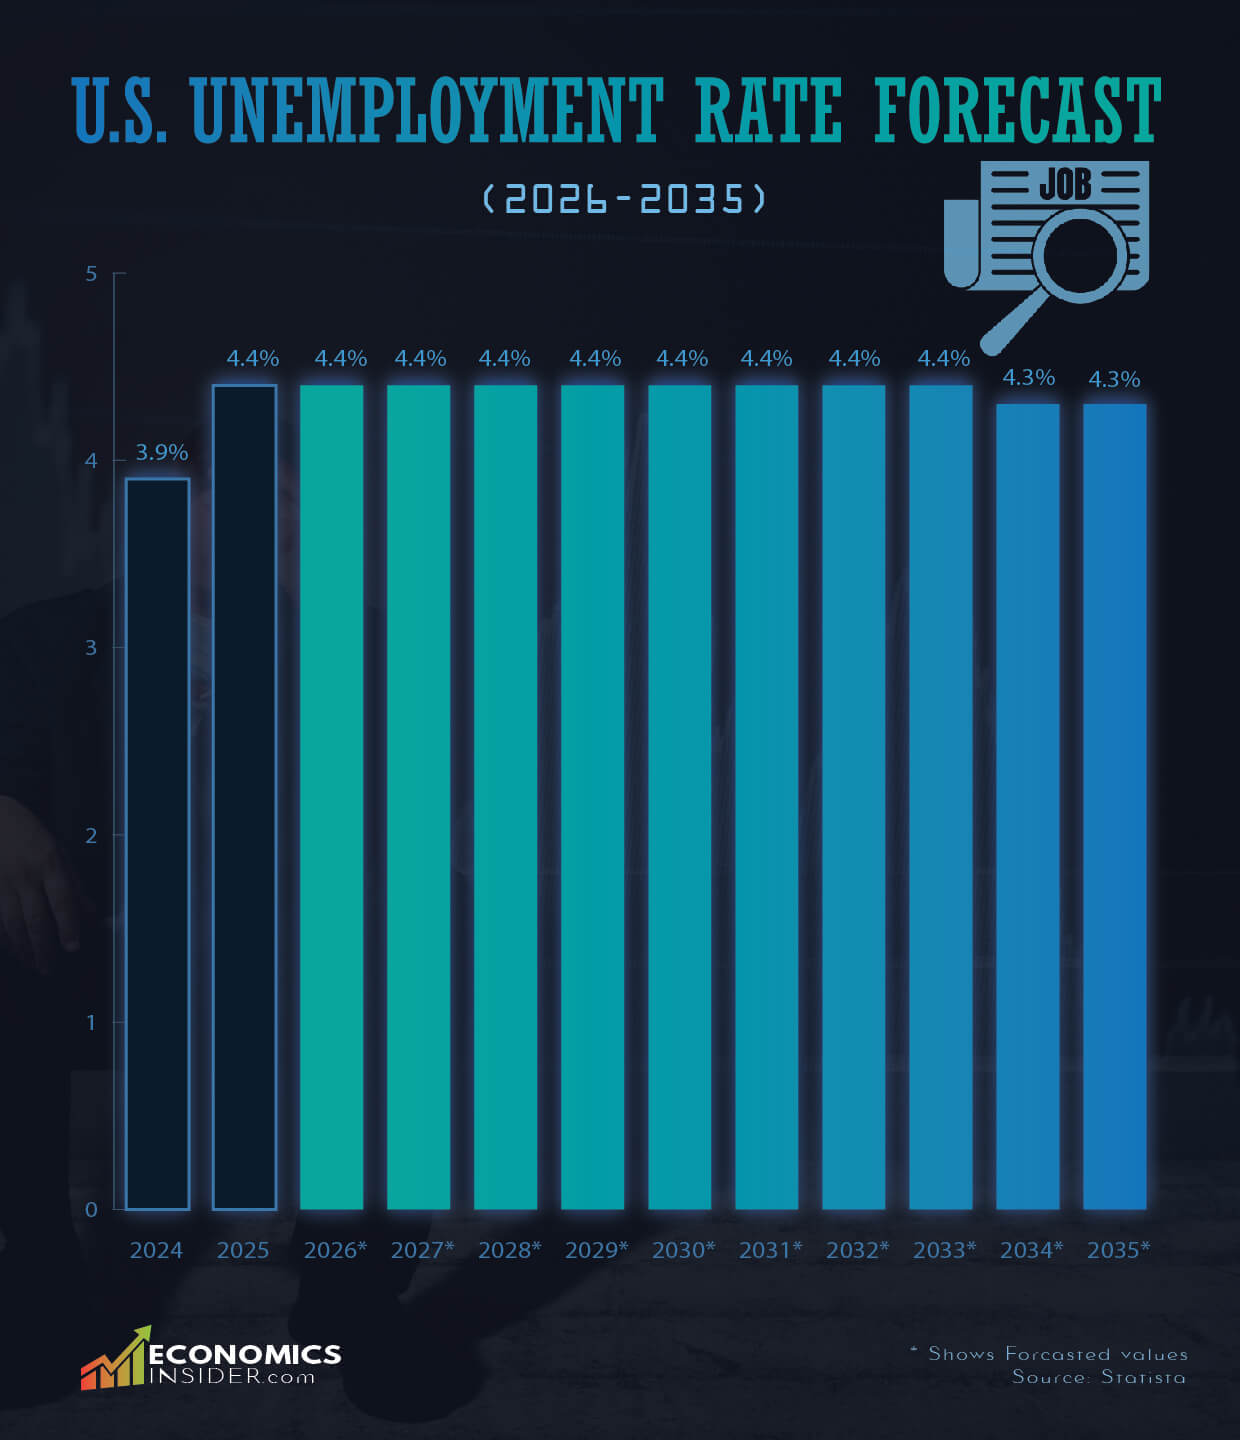
The following table, based on Statista data, shows projected U.S. unemployment rates from 2026 to 2035. Forecast rows are marked with an asterisk.
| Year | Unemployment Rate (%) |
|---|---|
| 2024 | 3.9 |
| 2025 | 4.4 |
| 2026* | 4.4 |
| 2027* | 4.4 |
| 2028* | 4.4 |
| 2029* | 4.4 |
| 2030* | 4.4 |
| 2031* | 4.4 |
| 2032* | 4.4 |
| 2033* | 4.4 |
| 2034* | 4.3 |
| 2035* | 4.3 |
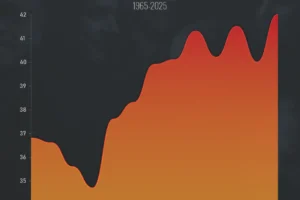
A Brief Historical Review of the U.S. Unemployment Rate
The U.S. labor market has seen big swings over the last two decades. The Great Recession of 2007–2009 raised unemployment sharply and left long scars in some industries and places. The rate climbed to roughly 10% in late 2009.
Between 2010 and early 2020, the job market slowly recovered. Unemployment fell for many years as hiring picked up, and the economy expanded. In early 2020, unemployment was low—roughly 3.5%—before the pandemic struck.
In March–April 2020, lockdowns and a near-stop in many services caused a sudden and massive loss of jobs. The unemployment rate spiked to about 14.7% in April 2020. A large share of those losses were temporary or tied to closed businesses, and many jobs returned as the economy reopened. After the pandemic spike, unemployment fell fast as businesses reopened and hiring recovered.
From 2021 through 2023, the U.S. saw rapid re-hiring, falling unemployment, and strong wage growth in some sectors. By 2024, unemployment was back near historically low levels. Starting in 2024 and into 2025, higher interest rates and global uncertainty slowed hiring.
In 2025, the labor market cooled again as firms slowed hiring and announced large rounds of layoffs. Firms in some sectors — especially tech, media, retail, and parts of services — announced major job cuts. These cuts show up in private layoff tallies even as the official unemployment rate moves more slowly.
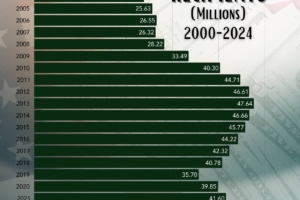
Number of SNAP Recipients Each Month (1969–2024)
Forecast of the U.S. Unemployment Rate
The forecast indicates that the U.S. unemployment rate is expected to remain steady at 4.4% from 2025 through 2033. Toward the end of the period, the rate is projected to dip slightly to 4.3% in 2034 and 2035. Overall, the forecast suggests a long period of stability in the mid-4% range, with only minor changes over the next decade.
Current layoffs
Challenger, Gray & Christmas report that U.S. employers announced tens of thousands of planned cuts in November 2025 and that year-to-date cuts passed the one-million mark. The November Challenger release recorded 71,321 announced job cuts for that month and pushed the 2025 total past one million announced cuts. That totals points to sectors and regions where job loss is concentrated—especially tech, retail, and some services.
These announced cuts do not always translate one-for-one into higher unemployment right away. Some workers find new jobs quickly, some announcements are phased or voluntary, and some layoffs reflect corporate restructuring rather than an economy-wide collapse. But when announced cuts are large and widespread, they raise the odds of slower hiring and higher unemployment over time.
Conclusion
The forecasted rise of U.S. unemployment into the mid-4% range is a change from the very low post-pandemic rates. It is far below the crisis peaks of 2009 and 2020, but it signals that the labor market has cooled. Large-scale layoffs announced in 2025—more than one million cuts—show that some industries face real pain, even if the national unemployment rate moves slowly.