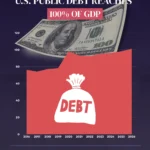












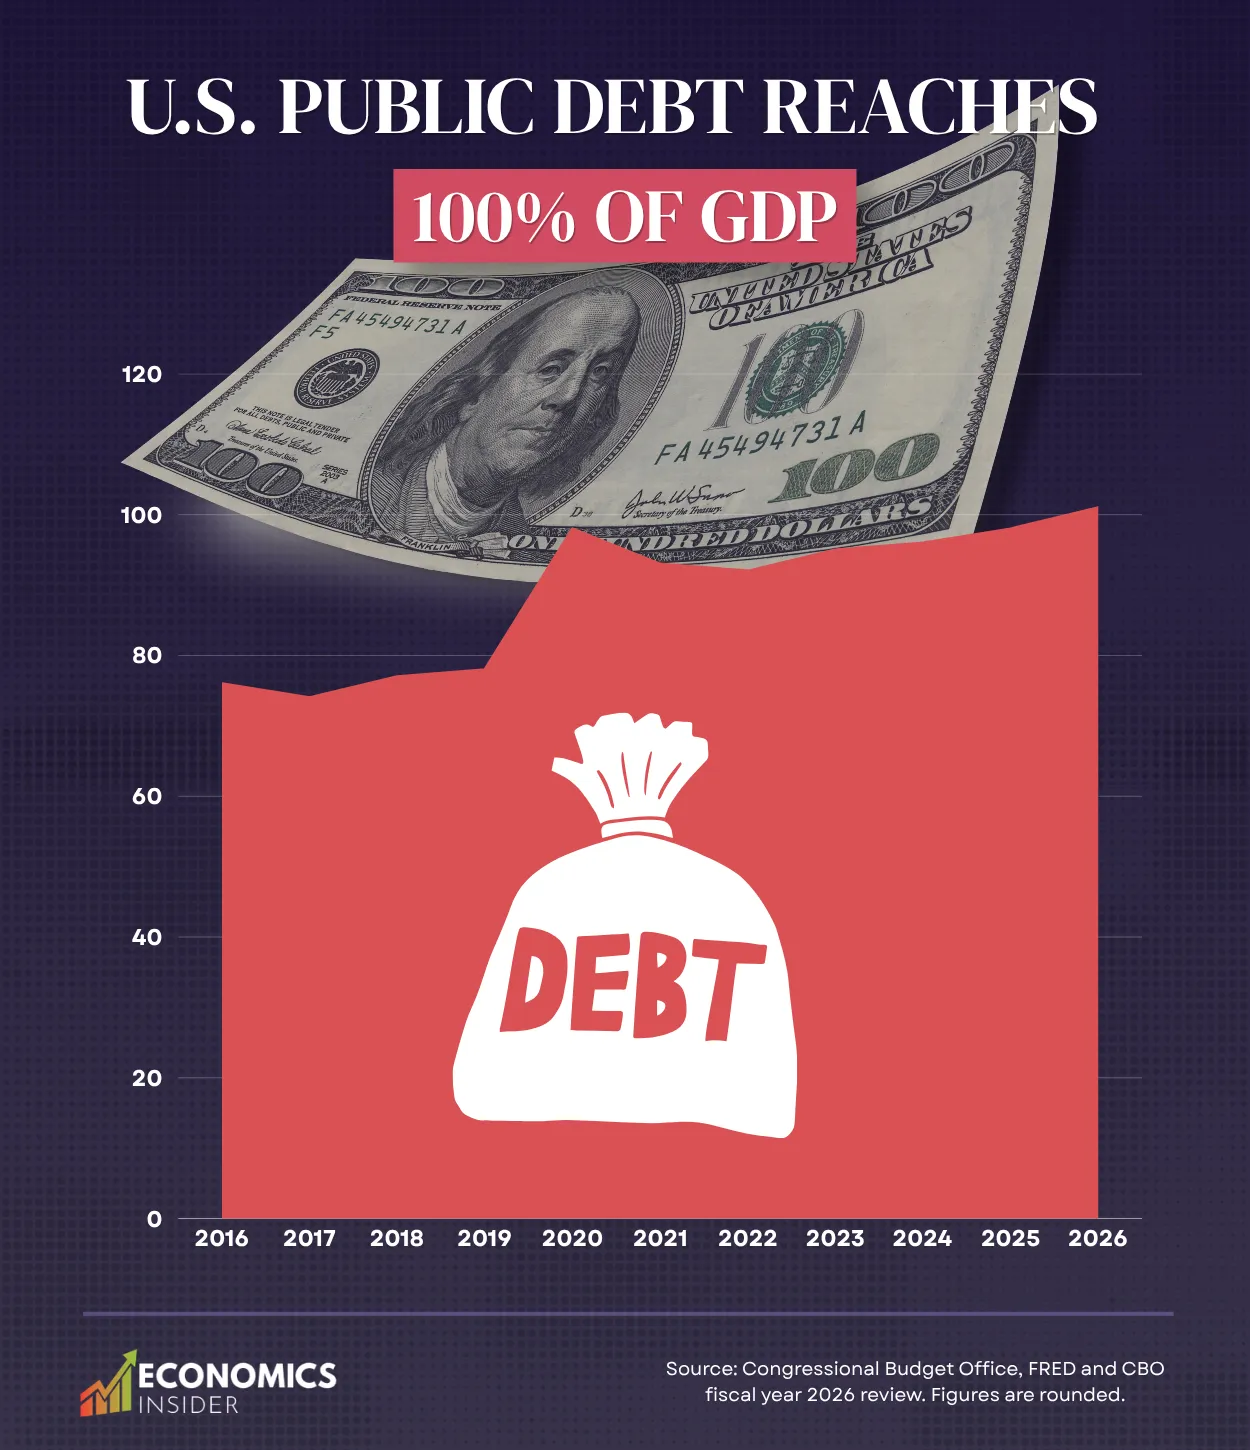
U.S. public debt is now roughly equal to the size of the entire economy. The Congressional Budget Office (CBO) estimates that the federal debt held by the public reached 100% of Gross Domestic Product (GDP) in fiscal year 2026. That’s the highest since the end of World War II. Now, the America’s public debt had hit roughly $32 trillion, matching the size of the economy.
But this isn’t only about a scary number. The debt has been climbing for years because the government keeps spending more than it collects. And the more it borrows, the more of the budget goes straight to interest.
Key Takeaways
- Debt held by the public hit 100% of GDP in fiscal year 2026, the highest since 1946.
- Total gross federal debt reached approximately $40.55 trillion in November 2026, equivalent to about 125% of U.S. GDP.
- The government ran a $2 trillion budget deficit in fiscal year 2026.
What Does 100% of GDP Actually Mean?
First, let’s quickly understand GDP. It’s the total value of all the goods and services a country produces in a year. Economists compare debt to GDP to get a sense of how heavy the debt is relative to the size of the economy. Here’s a simple example. Say a country produces $1 trillion in a year and owes $1 trillion. Its debt-to-GDP ratio is 100%. That’s the situation the U.S. is in now.
It doesn’t mean the government has to pay everything back by next year. That’s not how national debt works. It just means the amount owed is about equal to a full year of the country’s economic output.
One important distinction: this 100% figure refers to debt held by the public, not total federal debt. These are two different measures, and it’s important not to confuse them.
How Much Does the U.S. Owe in 2026?
According to the Joint Economic Committee’s November 2026 update, gross federal debt hit about $40.55 trillion in November 2026.
That total has two parts. The first is debt held by the public: Treasury securities owned by individuals, banks, investment funds, foreign governments, the Federal Reserve and other investors outside the federal government. The second is intragovernmental debt, which is money the government owes to its own accounts, like federal trust funds.
Here’s how it breaks down:
| Debt category | Amount |
|---|---|
| Debt held by the public | $32.77 trillion |
| Intragovernmental debt | $7.79 trillion |
| Total gross federal debt | $40.55 trillion |
Source: Joint Economic Committee, November 4, 2026. Figures are rounded.
That’s why some put the national debt at around $32 trillion, while others report more than $40 trillion. Neither figure is wrong. They’re simply measuring different things.
When economists compare debt with GDP, they usually use the public figure, since it reflects what the government has borrowed from outside investors and institutions.
How Has the Debt-to-GDP Ratio Changed Over Time?
America hasn’t always been this deep in debt. Around 2000, the federal budget was actually in surplus, and public debt was shrinking compared with the economy. Hard to imagine now.
Then things changed. The September 11 attacks, the wars in Afghanistan and Iraq, the 2008 financial crisis and the COVID-19 pandemic all pushed borrowing higher. Tax cuts and rising spending added to it.
Here’s how the ratio looked in some key years:
| Year | Debt held by public as % of GDP |
|---|---|
| 1946 | 106.3% |
| 2001 | 32% |
| 2010 | 59.9% |
| 2020 | 98.3% |
| 2025 | 99.0% |
| 2026 | 100.0% |
Sources: Congressional Budget Office, FRED and CBO fiscal year 2026 review. Figures are rounded.
After World War II, public debt was bigger than the whole economy. But the economy grew, and over the following decades the ratio fell. By 2001 it was down to around 32%. Then it turned around. By 2020, debt was nearly as big as the economy, and in 2026 it finally hit 100%.
Why Does America Keep Borrowing?
The simple explanation is that the government spends more money than it collects in revenue. This shortfall is known as the budget deficit. To make up the difference, Washington borrows money, and it has been doing so year after year for decades.
A few things are behind the gap.
1. Tax Cuts Have Cut Into Revenue
Over the last 25 years, the U.S. has passed several major tax cuts: the Bush cuts in 2001 and 2003, the extensions and changes that followed, and the Tax Cuts and Jobs Act of 2017. An analysis of CBO data by the Center for American Progress found that tax cuts introduced since 2001 have added more than $10 trillion to the national debt.
The logic is straightforward. If the government collects less in taxes but its commitments stay the same, it has to borrow the difference. Taxes are only part of the picture. Spending choices, the state of the economy and the cost of the existing debt matter just as much.
2. Social Security and Medicare
Social Security spending reached $1.67 trillion, while Medicare cost another $1.07 trillion in FY2026. These are two of the biggest items in the federal budget. Social Security pays retirement and other benefits. Medicare helps cover healthcare for older Americans and some people with disabilities.
Both cost more every year. More people are hitting retirement age, and healthcare keeps getting more expensive. That puts steady pressure on federal spending, and it’s not expected to ease anytime soon.
3. Wars and Emergencies
Afghanistan and Iraq wars cost billions, while the 2008 financial crisis forced the government to spend heavily to support the economy. Then COVID-19 brought another wave of massive spending to help businesses and households. At the time, this spending may be necessary, but it adds to the country’s growing debt
4. Rising Interest Payments
In fiscal year 2026, net interest on publicly held debt topped $1 trillion, according to the CBO’s budget projections. The government still has to pay for Social Security, Medicare, defense, infrastructure and everything else. If interest keeps climbing, there’s less left for those things, unless the government raises more revenue or borrows even more.
How Does This Compare With World War II?
The last time public debt was this high was during and right after World War II. The government spent enormous amounts on weapons, soldiers and supplies, and paid for it by issuing Treasury securities. Debt ended up bigger than the economy.
Afterward, the ratio slowly came down. A growing economy, rising revenue and changes in spending all helped.
Today, there’s no world war driving the borrowing. This debt built up through years of deficits, tax decisions, spending and rising interest costs.
Here’s a side-by-side look:
| Indicator | World War II period | 2026 |
|---|---|---|
| Public debt/GDP | 106.3% (1946) | 100.0% |
| Main pressure on borrowing | World War II | Persistent budget deficits |
| Economic situation | Wartime economy | Modern civilian economy |
| Government spending | Extremely high wartime spending | Social programs, defense, interest and other spending |
So today’s debt level is historically high, but it isn’t unheard of. The bigger question is whether the country can keep the economy growing while it deals with the debt.
What Happens If the Debt Keeps Growing?
Hitting 100% doesn’t mean a crisis is around the corner. The U.S. has a huge economy, collects taxes from millions of people and businesses, and borrows in its own currency. Investors around the world also hold Treasury securities.
Still, a growing debt can cause trouble over the long run.
One worry is the cost of borrowing. The more the government borrows, the more Treasury securities it has to sell, and if interest rates are high, financing that debt gets pricey.
Another is the budget itself. As interest payments grow, there’s less room for everything else, and lawmakers may eventually face tough choices about taxes, spending or borrowing.
Heavy government borrowing can also spill over into the wider economy. Depending on conditions, it can push interest rates up and make loans more expensive for businesses and households.
Where Is the Debt Headed by 2036?
The CBO has warned that it could keep rising over the next decade. In its February 2026 budget outlook, it projected that debt held by the public would go from 101% of GDP in 2026 to 120% by 2036.
Here’s the CBO’s projected path:
| Year | Projected public debt/GDP |
|---|---|
| 2026 | 101% |
| 2030 | 108% |
| 2036 | 120% |
Source: Congressional Budget Office, February 2026 budget outlook. These are baseline projections, not confirmed future figures.
The CBO also expects annual deficits to grow from about $1.9 trillion in 2026 to $3.1 trillion in 2036. If that happens, borrowing needs and interest costs get even bigger.
Of course, the real numbers could look different. Congress will make new tax and spending decisions, and the economy will change along the way.
Conclusion
Reaching 100% of GDP is a big moment in America’s history. It shows how much borrowing has piled up over the years. The country ran budget surpluses not long ago and now lives with constant deficits and rising interest bills. But it doesn’t mean the U.S. has to pay everything back overnight, and it doesn’t mean a crisis is guaranteed.
What matters is what comes next. If spending keeps outrunning revenue, the debt will keep growing, and higher interest payments will make the budget even harder to manage.