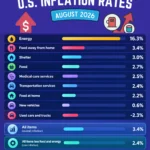




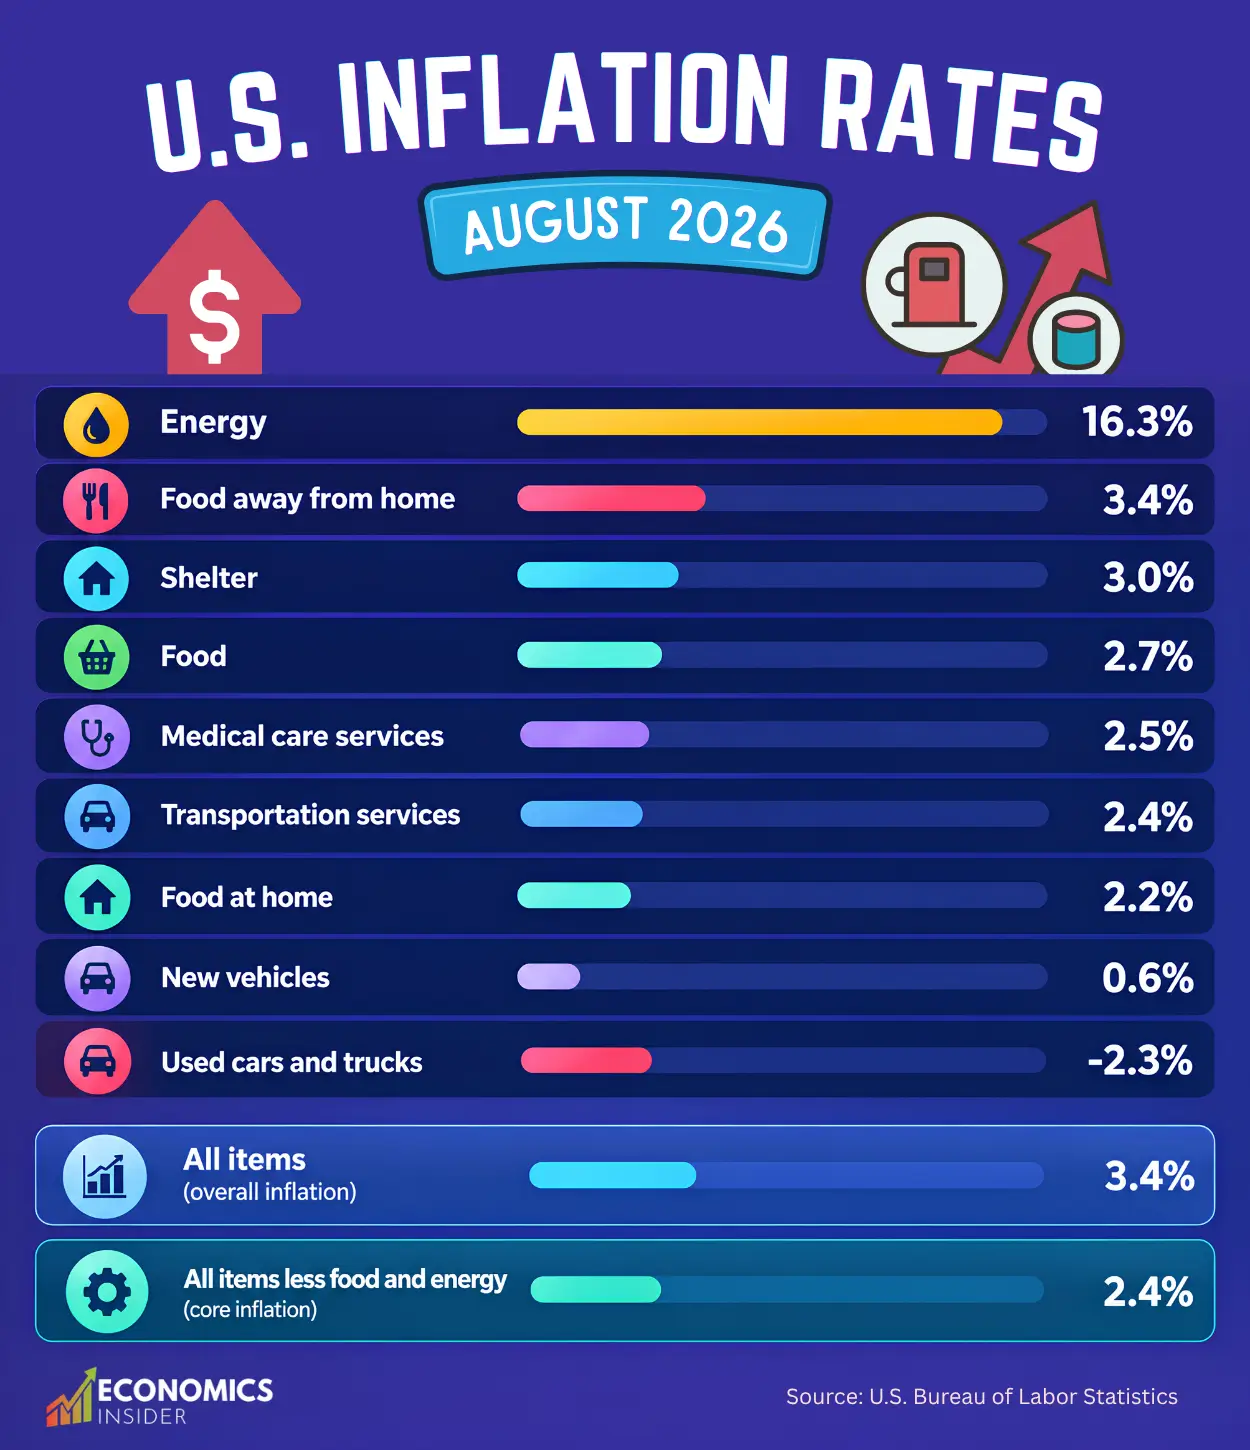
The latest data from the U.S. Bureau of Labor Statistics shows that consumer prices increased 3.4% in the 12 months through August 2026. Prices rose another 0.4% in August alone, after increasing 0.1% in July.
The biggest increase came from energy, where prices were up 16.3% from a year earlier. Gasoline prices were 27.4% higher, while fuel oil prices increased 52.0%.
Food prices also continued to rise, although at a much slower pace. Food prices were up 2.7% over the year, while prices for food purchased at restaurants increased 3.4%.
Key Takeaways
- U.S. consumer prices rose 3.4% over the year through August 2026.
- Energy prices rose 16.3%, making energy the fastest-rising major category.
- Gasoline prices increased 27.4%, while airline fares rose 23.4%.
- Housing costs were still rising, with shelter prices up 3.0% over the year.
Which Prices Are Rising the Most?
The overall inflation rate can hide large differences between individual products and services. While some price levels have risen only marginally within the year, there are others that have risen rapidly.
The table below shows selected categories with some of the largest increases through August 2026.
| Category | Price change, Aug. 2025–Aug. 2026 |
| Fuel oil | +52.0% |
| Gasoline | +27.4% |
| Airline fares | +23.4% |
| Energy overall | +16.3% |
| Tobacco & smoking products | +6.3% |
| Hospital services | +5.2% |
| Motor vehicle maintenance & repair | +5.2% |
| Water, sewer & trash services | +4.8% |
| Natural gas | +4.4% |
| Electricity | +3.8% |
| Food away from home | +3.4% |
| Shelter | +3.0% |
| Food overall | +2.7% |
| Overall CPI | +3.4% |
Source: U.S. Bureau of Labor Statistics, Consumer Price Index, August 2026.
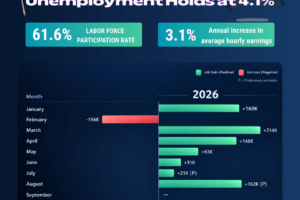
US Jobs Report August 2026: 162,000 Jobs Added as Unemployment Holds at 4.1%
Energy Prices Are Rising Much Faster Than Most Other Prices
The overall energy index increased 16.3% in the 12 months through August. Energy commodity prices, which include products such as gasoline and fuel oil, increased 28.0%.
Fuel oil recorded the largest increase among the categories shown by the BLS, rising 52.0% from a year earlier. Gasoline was also much more expensive. The gasoline index increased 27.4% over the year. Natural gas prices increased 4.4%, while electricity prices rose 3.8%.
Energy prices also moved sharply during August. The energy index increased 2.1% during the month, while gasoline prices rose 3.9%. BLS said gasoline accounted for more than one-third of the total monthly increase in consumer prices.
Gasoline Is One of the Biggest Sources of Higher Costs
For many Americans, gasoline is one of the most visible effects of inflation. Gasoline prices were 27.4% higher in August than they were a year earlier.
The increase was also noticeable in the latest monthly data. Gasoline prices rose 3.9% in August after falling in both June and July. This means the cost of driving can change quickly even when inflation in other parts of the economy is moving more slowly.
The higher gasoline prices also matter beyond the gas station. Fuel is an important cost for businesses that transport people and goods, so changes in energy prices can affect other parts of the economy.
Airline Fares Have Also Jumped
Air travel is another area where prices have risen sharply. The BLS index for airline fares increased 23.4% between August 2025 and August 2026. Airline fares also increased 2.7% during August alone.
This is one reason the overall inflation number does not tell the whole story. A household that spends little on air travel may not feel this increase very strongly, while someone who flies regularly could notice it much more.
Housing Costs Are Still Rising
Housing remains one of the largest parts of the inflation picture. The overall shelter index increased 3.0% over the year through August. Rent of primary residences increased 2.7%, while owners’ equivalent rent increased 3.1%.
Shelter also has a large weight in the CPI because housing represents a major part of household spending. The shelter index accounts for more than one-third of the CPI’s relative importance.
In August, shelter prices increased 0.3%. That is slower than the increases seen in energy and gasoline, but housing costs continue to put pressure on household budgets.
Food Prices Are Rising More Slowly
Food inflation is much lower than energy inflation. Overall food prices increased 2.7% over the year through August. However, there was a difference between groceries and restaurant food. Prices for food at home, which covers groceries, increased 2.2%. Prices for food away from home increased 3.4%. Within grocery categories, prices also varied.
| Food category | 12-month change |
| Nonalcoholic beverages | +3.7% |
| Fruits and vegetables | +3.2% |
| Cereals and bakery products | +2.6% |
| Other food at home | +2.4% |
| Meats, poultry, fish and eggs | +1.1% |
| Dairy products | -0.3% |
Source: U.S. Bureau of Labor Statistics, August 2026 CPI.
So while food prices are still increasing overall, some grocery categories have seen very small increases or even price declines.
Restaurant Prices Are Rising Faster Than Grocery Prices
Eating out has become more expensive than buying food for the home. Prices for food away from home increased 3.4% over the year. Full-service meals and snacks increased 3.5%, while limited-service meals and snacks increased 3.2%. That difference may seem small, but it adds up over time for households that regularly eat at restaurants.
Some Prices Are Actually Falling
Inflation does not mean that every price goes up. Several categories were cheaper in August 2026 than they were a year earlier.
Used cars and trucks were down 2.3%, while medical care commodities were down 2.7%. Motor vehicle insurance was also down 5.1% over the year. Dairy products declined 0.3%.
What About Inflation Without Food and Energy (Core Inflation)?
Core inflation excludes food and energy because those prices can move sharply from month to month.
In August, prices excluding food and energy increased 2.4% from a year earlier. That was lower than the 3.4% increase in the overall CPI. The difference is largely connected to the strong increase in energy prices during the past year.
Services excluding energy services increased 3.0% over the year, while commodities excluding food and energy commodities increased only 0.7%.
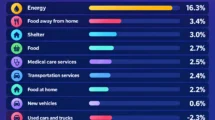
U.S. Inflation in One Table
The latest inflation data shows a wide gap between different parts of the economy.
| Major category | Inflation, Aug. 2026 |
| Energy | 16.3% |
| Food | 2.7% |
| Food at home | 2.2% |
| Food away from home | 3.4% |
| Shelter | 3.0% |
| Medical care services | 2.5% |
| Transportation services | 2.4% |
| New vehicles | 0.6% |
| Used cars and trucks | -2.3% |
| All items | 3.4% |
| All items less food and energy | 2.4% |
12-month percentage change through August 2026. Source: U.S. Bureau of Labor Statistics.
What the Numbers Tell Us
The inflation picture in the U.S. in 2026 is not the same across every part of the economy. The overall CPI increased 3.4% over the year through August. But energy prices rose far faster, while many other categories increased much more slowly.
Gasoline, fuel oil and airline fares recorded some of the largest increases. Housing costs continued to rise, although at a much slower rate than energy. Food prices also increased, with restaurant prices rising faster than grocery prices.
At the same time, some categories became cheaper, including used vehicles, medical care commodities and motor vehicle insurance.
For American households, the effect of inflation depends heavily on what they buy. Someone who drives long distances, flies frequently or uses heating oil can face a very different increase in living costs from someone whose main expenses are housing and groceries.