


For the last 25 years, the United States has had chronic budget deficits. The only exception was in 2001. Since then, the US government has run a persistent fiscal deficit each year. Deficits were smaller in the early 2000s, increased significantly in the 2008 financial crisis, became smaller again for some years, but increased again in 2020 due to the COVID-19 pandemic. Even after the pandemic, the deficits remained large. This post breakdown the US deficit by year for the past 25 years.
Key Takeaways
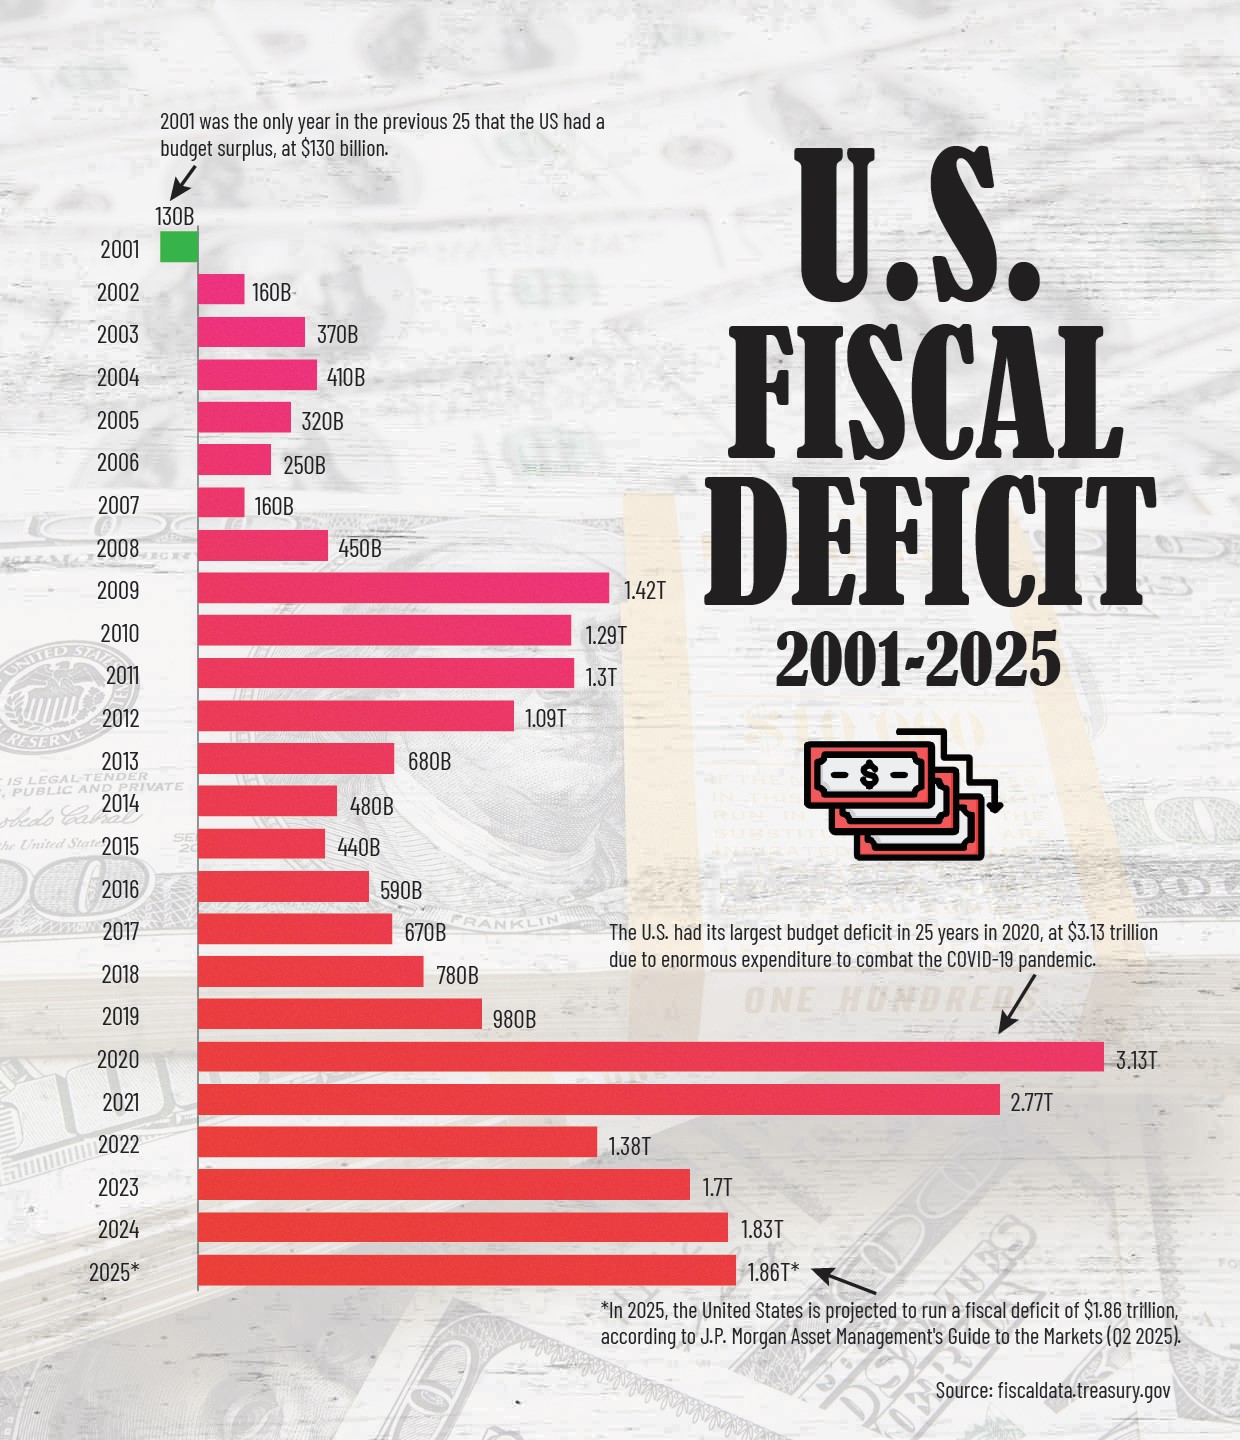
- The U.S. had its largest budget deficit in 25 years in 2020, at $3.13 trillion due to enormous expenditure to combat the COVID-19 pandemic, as indicated by the US deficit by year data.
- 2001 was the only year in the previous 25 that the US had a budget surplus, at $130 billion.
What Is a Fiscal Deficit?
Fiscal deficit is the situation when the government spends more than it collects in taxes and other sources of revenue in a given year. If the government’s spending is equal to its income, it is referred to as a balanced budget. But if the government has more income than it spends, it is referred to as a budget surplus.
When the federal government spends more money than it receives, it pays for the difference by borrowing funds, usually in the form of issuing U.S. Treasury securities. Repeated deficits over time have built up the US national debt.
The U.S. Fiscal deficit By Year (2001-2025)
The below table illustrates U.S. federal fiscal deficit or surplus between the years 2001 to 2025, in trillions of US dollars. A positive figure indicates a deficit, and the negative figure for 2001 is for a surplus. This table gives the US deficit by year in detail.
| Year | Total Deficit |
|---|---|
| 2001 | -130 billion |
| 2002 | 160 billion |
| 2003 | 370 billion |
| 2004 | 410 billion |
| 2005 | 320 billion |
| 2006 | 250 billion |
| 2007 | 160 billion |
| 2008 | 450 billion |
| 2009 | 1.42 trillion |
| 2010 | 1.29 trillion |
| 2011 | 1.3 trillion |
| 2012 | 1.09 trillion |
| 2013 | 680 billion |
| 2014 | 480 billion |
| 2015 | 440 billion |
| 2016 | 590 billion |
| 2017 | 670 billion |
| 2018 | 780 billion |
| 2019 | 980 billion |
| 2020 | 3.13 trillion |
| 2021 | 2.77 trillion |
| 2022 | 1.38 trillion |
| 2023 | 1.7 trillion |
| 2024 | 1.83 trillion |
| 2025* | 1.86 trillion |
The data is sourced from the fiscaldata.treasury.gov.
*In 2025, the United States is projected to run a fiscal deficit of approximately $1.86 trillion, according to J.P. Morgan Asset Management’s Guide to the Markets (Q2 2025).
The data indicates the deficits were smaller and manageable during the mid-2000s. Yet, major events such as the 2008 financial crisis and the COVID-19 pandemic in 2020 prompted monumental increases in government expenditures, resulting in significantly larger deficits. Even following the pandemic, the annual deficit has remained over $1 trillion, which shows that large amounts of deficits have become the norm in the United States.
US Federal Budget 2025: Spending, Revenue, and the $1.8 Trillion Deficit
U.S. Fiscal Deficit History (2001–2024)
2001: The Sole Year of Surplus
In 2001, America experienced a modest budget surplus of $130 billion (or -$0.13 trillion). This is because the economy was robust, there was low unemployment, and the government was taking in more money than it spends. However, things changed quickly. In 2002, the U.S. returned to deficit due to tax decreases, a slowdown in the economy, and a large spike in military expenditures following the 9/11 attacks. The transition is evident from the US deficit by year chart.
2008: The Financial Crisis
In 2008, the budget deficit increased to $450 billion as the government responded to the financial crisis. Major banks and other financial institutions were failing, so the government intervened with bailouts and stimulus packages in an effort to halt the economy from further deterioration.
At the same time, the recession caused businesses to slow down and people to lose jobs, which meant the government collected less money in taxes—while spending more to support the economy.
2009–2012: Crisis Response Continues
Between 2009 and 2012, the budget deficits in the U.S. exceeded $1 trillion annually. The highest deficit was in 2009 at $1.42 trillion. This resulted primarily due to huge government expenditure through the American Recovery and Reinvestment Act, financial bailouts, and stimulus measures to stabilize the economy.
The Great Recession affected the economy significantly, and the economy took years to recover. Unemployment remained high and business activity was low, resulting in low tax revenue and high spending.
2013–2019: Slowing Decline but Still Deficits
From 2013 to 2019, the budget deficit remained below $1 trillion and fluctuated between $680 billion and $980 billion. During this period, the economy gradually picked up, and the government brought in slightly more revenue from taxation. But the United States was still spending a great deal—particularly on defense and programs such as Social Security and Medicare.
2020: The Pandemic Shock
In 2020, the biggest ever budget deficit that the U.S. has ever recorded was $3.13 trillion. This is because the government introduced the CARES Act and other relief programs in emergencies to aid individuals and businesses affected by the COVID-19 pandemic. These actions led to the government expenditure increasing dramatically.
Meanwhile, the economy was slowing down, and tax revenues decreased. In 2021, although the economy began to recover, the deficit remained extremely high at $2.77 trillion. The government continued to spend a great deal on stimulus payments, unemployment compensation, and vaccine initiatives, as the nation continued to address the pandemic.
2022–2024: Post-Pandemic Normalization
By 2022, the deficit declined to $1.38 trillion, which was an improvement but still significantly higher than the figures prior to the pandemic. Between 2023 and 2024, the deficit increased once more to $1.70 trillion and $1.83 trillion. This rise indicates that the government continues to spend much, while tax income has not increased sufficiently to match it. This trend is amply evident in the US deficit by year statistics.
The Growth in U.S. Debt
Decades of budget deficits have added up over the years. The total U.S. national debt has reached $36 trillion in 2025 which is equivalent to approximately 120% of the US GDP. To finance this borrowing, the government issues U.S. Treasury securities which are purchased by individuals, banks, and governments within the U.S. as well as globally.
Large owners of US treasury securities are the Federal Reserve, American citizens and businesses, and other foreign nations like Japan and China. The U.S. has always been able to pay back its debts, but as the debt grows, the cost of paying interest also increases. This rising debt and interest make it harder to manage the country’s finances over the long term, a consequence closely related to the trends seen in the US deficit by year data.
Conclusion
Looking back over the past 25 years, it’s clear that the U.S. government has mostly run budget deficits, with only one year showing a surplus. Large events such as the 2008 financial crisis and the COVID-19 pandemic took a massive toll on these deficits. Even under more peaceful economic conditions, though, increasing expenses for programs such as Social Security and Medicare, as well as lagging growth in government revenues, have maintained the deficits at high levels. Due to this, the US debt has increased significantly to $35 trillion by 2025.


Add Comment