


The US Debt to GDP ratio has experienced numerous ups and downs in the last 75 years. In 1950, in the aftermath of World War II, US debt was $3.4 trillion, with a debt-to-GDP ratio of 92%. Subsequently, for the next couple of decades, this ratio consistently decreased and reached a low in the 1970s because of robust post-war economic growth and several balanced budgets.
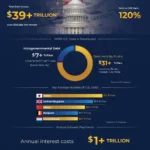
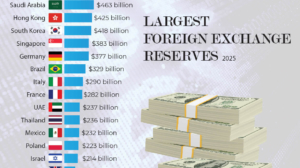
But since the 1980s, the US debt to GDP ratio began to increase again. This was caused by the tax cuts, increased military expenditure, and sluggish economic growth that drove the debt higher. Furthermore, geopolitical events such as the 2008 financial crisis and the COVID-19 pandemic in 2020 resulted in huge borrowing and federal expenditures, which led to an unprecedented spike in the debt-to-GDP ratio. Today, as of 2025, the US national debt stands at $36 trillion, which is the highest in the world in absolute terms.
Key Takeaways
- From the 1950s to the 1970s, the US Debt to GDP ratio declined steadily as a result of economic growth and controlled federal expenditure.
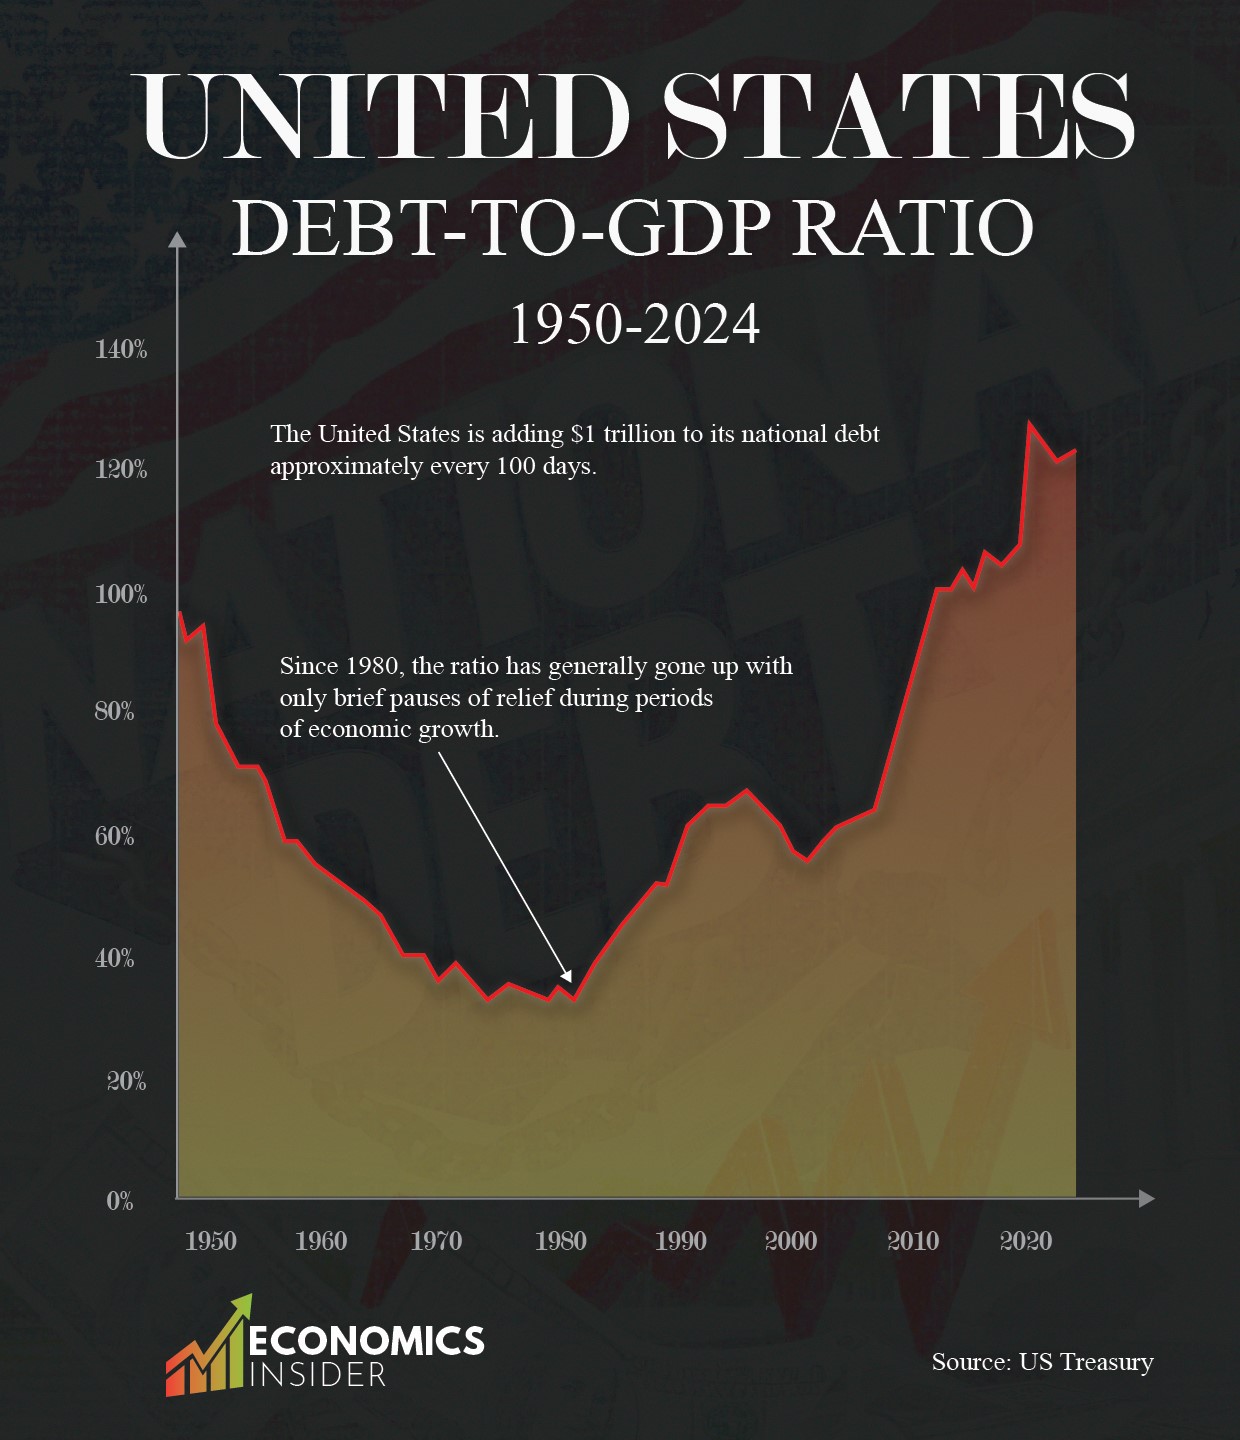
- Since the 1980s, the ratio has generally gone up with only brief pauses of relief during periods of economic growth.
- The United States is adding $1 trillion to its national debt approximately every 100 days.
US Debt to GDP Ratio 1950-2024
The table below indicates the US debt-to-GDP ratio between 1950 and 2024.
| Year | Debt to GDP Ratio (%) |
|---|---|
| 1950 | 92% |
| 1951 | 78% |
| 1952 | 73% |
| 1953 | 70% |
| 1954 | 70% |
| 1955 | 68% |
| 1956 | 62% |
| 1957 | 58% |
| 1958 | 58% |
| 1959 | 56% |
| 1960 | 54% |
| 1961 | 53% |
| 1962 | 51% |
| 1963 | 49% |
| 1964 | 47% |
| 1965 | 45% |
| 1966 | 41% |
| 1967 | 39% |
| 1968 | 39% |
| 1969 | 36% |
| 1970 | 35% |
| 1971 | 36% |
| 1972 | 35% |
| 1973 | 34% |
| 1974 | 32% |
| 1975 | 33% |
| 1976 | 35% |
| 1977 | 35% |
| 1978 | 34% |
| 1979 | 32% |
| 1980 | 33% |
| 1981 | 32% |
| 1982 | 34% |
| 1983 | 39% |
| 1984 | 40% |
| 1985 | 43% |
| 1986 | 47% |
| 1987 | 49% |
| 1988 | 51% |
| 1989 | 51% |
| 1990 | 55% |
| 1991 | 60% |
| 1992 | 63% |
| 1993 | 65% |
| 1994 | 65% |
| 1995 | 66% |
| 1996 | 66% |
| 1997 | 64% |
| 1998 | 62% |
| 1999 | 60% |
| 2000 | 56% |
| 2001 | 55% |
| 2002 | 58% |
| 2003 | 60% |
| 2004 | 61% |
| 2005 | 62% |
| 2006 | 62% |
| 2007 | 63% |
| 2008 | 68% |
| 2009 | 82% |
| 2010 | 91% |
| 2011 | 96% |
| 2012 | 100% |
| 2013 | 100% |
| 2014 | 102% |
| 2015 | 100% |
| 2016 | 105% |
| 2017 | 104% |
| 2018 | 105% |
| 2019 | 107% |
| 2020 | 126% |
| 2021 | 124% |
| 2022 | 121% |
| 2023 | 121% |
| 2024 | 123% |
The data is sourced from the US Treasury.
1950s–1970s: Post-War Growth and Declining Debt Ratio
In 1950, the US carried a public debt of approximately $3 trillion and a debt-to-GDP ratio of 92%. This high percentage was due to the massive borrowing during World War II. However, the Post-war boom enabled the nation to expand its economy more rapidly than it accumulated debt. The robust industrial production, growing middle class, and increasing international trade led the US debt-to-GDP ratio to decline steadily to 34% in 1973.
In addition, this huge fall in the debt-to-GDP ratio over this period was not only a result of economic growth and increasing trade, but also because of a number of budget surpluses and managed federal expenditure.
1980s–1990s: Reagan Era and Growing Deficits
The 1980s was a significant turning point in the US economic history. During President Ronald Reagan’s tenure, the U.S. implemented high levels of tax reduction and increased expenditures on the military as a measure to meet the demands of the Cold War. While these actions were intended to spur economic growth, they also led to enormous budget deficits.
The US national debt, in 1984, stood at $4.7 trillion, and the debt-to-GDP ratio had risen to 40% compared to 32% in 1981.
As of the early 1990s, the debt-to-GDP ratio had climbed to 60%. Various attempts at curbing this rising debt-to-GDP ratio were made by the federal government. During the presidencies of George H.W. Bush and Bill Clinton, there were tax hikes and spending controls. These reforms managed to stabilize the ratio to some extent. By 2000, the US national debt rose to $10 trillion.
2000s: War on Terror and the Great Recession
Post-2000, America entered into a new phase of debt expansion. The 9/11 terrorist attack resulted in new military intervention in Afghanistan and Iraq, which resulted in an increase in military expenditure on a large scale. Concurrently, tax cuts were implemented, which resulted in a decrease in federal income. In 2006, the US debt reached $13 trillion with a debt-to-GDP ratio of 62%.
Then came the 2008 global financial crisis. In order to stabilize and revive the economy from recession, the federal government enacted significant stimulus packages. This led to an increase in national debt to around $14.5 trillion in 2008. The national debt became $20 trillion, and the debt-to-GDP ratio became 96% by 2011.
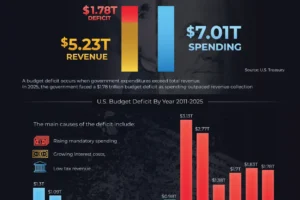
US Federal Budget 2025: Spending, Revenue, and the $1.8 Trillion Deficit
2010s: Recovery and Slower Growth
Between 2011 and 2020, the American economy gradually recovered from the financial crisis. The debt, however, increased on account of persistent budget deficits and growing healthcare and social security costs. In 2016, the debt had grown to $25 trillion, and the US debt to GDP ratio was 105%.
Additionally, there was limited political agreement on decreasing the increasing US debt. Neither large tax reforms nor budget cuts were enough to stop the trend. Consequently, the ratio continued to spike and remained above 100% during the latter part of the 2010s.
2020s: COVID-19 Pandemic and Record Debt
The COVID-19 pandemic began a new wave of federal debt. The federal government incurred trillions of dollars in relief measures, unemployment benefits, economic stimulus packages to businesses, and medical care. This drastically increased the debt. At the height of the COVID-19 pandemic in 2020, the US debt crossed $32 trillion, with the debt-to-GDP ratio reaching 126%—one of the highest in U.S. history.
Even though the economy started to bounce back in 2021 and 2022, the debt was still high. As of 2025, the U.S. national debt is $36 trillion, and the country is now adding about $1 trillion every 100 days.
Major Causes of Rising The US Debt
One of the primary reasons for the increased U.S. national debt is the persistent budget deficit. The government’s expenses have exceeded its tax revenues for the majority of the last century. Except for a brief surplus in 2001, the U.S. has been running deficits annually for the previous 25 years. The deficits were huge ones in the 2008 financial crisis and in the 2020 COVID-19 pandemic.
Yet another major contributor to increasing US debt is the US aging population. According to the Peterson Institute for International Economics, approximately 10,000 Americans reach age 65 daily and by 2030, about 71 million Americans will be senior citizens. This results in increasing expenditures on programs such as Social Security and Medicare.
Meanwhile, healthcare in the U.S. is extremely expensive at $12,742 per capita, which is more than double the OECD average of $6,850. These increasing health expenditures burden the federal budget and drive the national debt even higher.
Conclusion
The US Debt to GDP ratio has experienced significant fluctuations over the past 75 years. From the post-WWII decline in debt levels to today’s high borrowing and rising debt ratios, the trend shows how national events and policy decisions shape the economy. As of 2025, the national debt has reached a massive $36 trillion, and it’s growing every second.


Add Comment